- Canadian Dollar broadly turns lower amidst Crude Oil rout.
- Canada economic data docket is thin this week.
- Crude Oil tumbles once again in choppy trading as downside pressure mounts.
The Canadian Dollar (CAD) saw downside pressures across the major currencies board on Monday, getting pushed down the charts by a backsliding Crude Oil market to kick off the second week of 2024.
Canadian International Merchandise Trade Balance and Building Permits, both slated for release on Tuesday, represent the only data showings for the Canadian Dollar on this week’s economic calendar. Markets are still adjusting after last Friday’s US Nonfarm Payrolls (NFP) print saw heavy revisions to previous periods.
Weakening economic figures are the name of the game for data points from Canada, with Tuesday’s Canadian International Merchandise Trade Balance forecast to decline from 2.97 billion to 1.8 billion for November. Meanwhile, Canadian November Building Permits are likewise expected to slip from 2.3% to 2.0%.
Daily digest market movers: Canadian Dollar softens on despondent Crude Oil demand outlook
- Another slump in Crude Oil is dragging down the Canadian Dollar on waffling Middle East barrel prices.
- Saudi Arabia slashed the prices they charge to trading partners in Asia for Saudi crude as production cuts from the Organization of Petroleum Exporting Countries (OPEC) continue to get foiled by slumping barrel demand from key oil market drivers such as China.
- US Crude Oil production continues to pump at or near record levels near 13 million barrels per day.
- The legs continue to get kicked out from underneath broad market expectations of global undersupply that has yet to materialize despite months of production cuts.
- Last Friday’s US NFP goosed market expectations of Fed rate cuts after printing well above expectations, despite a steep downside revision to previous periods’ prints. A firm employment outlook in the US makes it less likely that the Federal Reserve (Fed) will get pushed into a rate cut cycle as soon as investors were initially hoping for.
- Key US data for this week lands on Thursday with another round of the US Consumer Price Index (CPI) inflation print.
- Headline annualized US CPI inflation is expected to tick up slightly from 3.1% to 3.2% for December.
Canadian Dollar price today
The table below shows the percentage change of Canadian Dollar (CAD) against listed major currencies today. Canadian Dollar was the weakest against the Japanese Yen.
| USD | EUR | GBP | CAD | AUD | JPY | NZD | CHF | |
| USD | -0.12% | -0.28% | -0.05% | -0.03% | -0.40% | 0.05% | -0.38% | |
| EUR | 0.12% | -0.15% | 0.09% | 0.11% | -0.26% | 0.19% | -0.25% | |
| GBP | 0.28% | 0.15% | 0.23% | 0.26% | -0.11% | 0.33% | -0.11% | |
| CAD | 0.05% | -0.07% | -0.23% | 0.02% | -0.32% | 0.10% | -0.32% | |
| AUD | 0.03% | -0.10% | -0.25% | -0.02% | -0.34% | 0.08% | -0.35% | |
| JPY | 0.36% | 0.27% | 0.10% | 0.35% | 0.37% | 0.45% | 0.00% | |
| NZD | -0.03% | -0.19% | -0.32% | -0.10% | -0.06% | -0.45% | -0.45% | |
| CHF | 0.38% | 0.26% | 0.11% | 0.34% | 0.36% | 0.00% | 0.44% |
The heat map shows percentage changes of major currencies against each other. The base currency is picked from the left column, while the quote currency is picked from the top row. For example, if you pick the Euro from the left column and move along the horizontal line to the Japanese Yen, the percentage change displayed in the box will represent EUR (base)/JPY (quote).
Technical Analysis: Canadian Dollar slides to 3-week low on soft barrel bids, USD/CAD tests 1.3400
The Canadian Dollar (CAD) saw further downside on Monday, before moderating in the back half of the US market session. Selling pressure sent the Loonie lower against all of its major currency peers. Heading towards the Monday closing bell, the Canadian Dollar was down a third of a percent against the Japanese Yen (JPY) and the Swiss Franc (CHF), and shedding a quarter of a percent against the Pound Sterling (GBP).
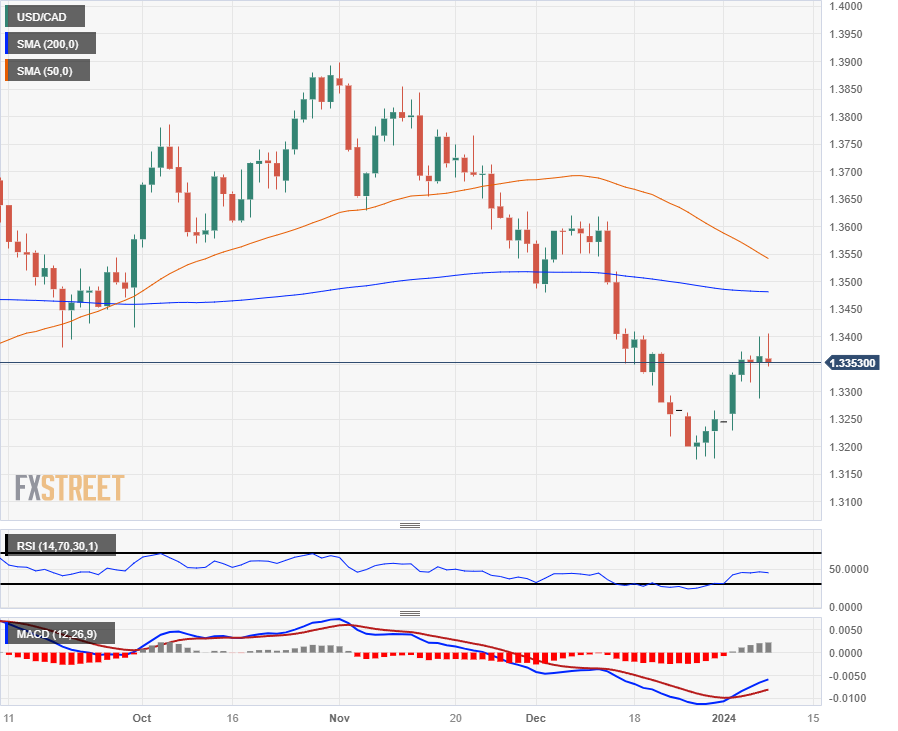
Canadian Dollar losses against the US Dollar (USD) remain limited on Monday, but they are still in the red as the USD/CAD pair extended to test the 1.3400 handle. The Loonie has shed 1.75% against the Greenback bottom-to-top from late December’s bottom bids near 1.3177.
The US Dollar has closed up or mostly flat against the Canadian Dollar for seven consecutive trading days, and Monday is set to chalk in an eighth consecutive loser for the CAD.
A continued upswing in the USD/CAD is set for a challenge from the near-term technical ceiling from the 200-day Simple Moving Average (SMA) just below the 1.3500 major handle, while a downside run into the 1.3200 region will see the pair testing into five-month lows below 1.3175.
USD/CAD Hourly Chart
USD/CAD Daily Chart
Interest rates FAQs
Interest rates are charged by financial institutions on loans to borrowers and are paid as interest to savers and depositors. They are influenced by base lending rates, which are set by central banks in response to changes in the economy. Central banks normally have a mandate to ensure price stability, which in most cases means targeting a core inflation rate of around 2%.
If inflation falls below target the central bank may cut base lending rates, with a view to stimulating lending and boosting the economy. If inflation rises substantially above 2% it normally results in the central bank raising base lending rates in an attempt to lower inflation.
Higher interest rates generally help strengthen a country’s currency as they make it a more attractive place for global investors to park their money.
Higher interest rates overall weigh on the price of Gold because they increase the opportunity cost of holding Gold instead of investing in an interest-bearing asset or placing cash in the bank.
If interest rates are high that usually pushes up the price of the US Dollar (USD), and since Gold is priced in Dollars, this has the effect of lowering the price of Gold.
The Fed funds rate is the overnight rate at which US banks lend to each other. It is the oft-quoted headline rate set by the Federal Reserve at its FOMC meetings. It is set as a range, for example 4.75%-5.00%, though the upper limit (in that case 5.00%) is the quoted figure.
Market expectations for future Fed funds rate are tracked by the CME FedWatch tool, which shapes how many financial markets behave in anticipation of future Federal Reserve monetary policy decisions.
Read the full article here