- EUR/USD drifted below 1.0800 after EU sentiment missed the mark.
- US GDP came in mixed, driving EUR/USD back to baseline.
- US PCE inflation to be the key data release this week.
EUR/USD sagged early Friday after European sentiment indicators came in below expectations, and a lopsided print in US Gross Domestic Product (GDP) figures kept the pair in familiar territory midweek.
Thursday brings plenty of data for investors to chew on with German Retail Sales and Consumer Price Index (CPI) numbers, which will be closely followed by US Personal Consumption Expenditure Price Index (PCE) inflation. Friday will round out the week with pan-European Harmonized Index of Consumer Prices (HICP) inflation, as well as the US ISM Manufacturing Purchasing Managers Index (PMI) for February.
Daily digest market movers: EUR/USD churns near 1.0800 once again on mixed data
- Europe’s Economic Sentiment Indicator fell to 95.4 in February versus the expected 96.7. January printed at 96.1 after a slight revision from 96.2.
- US QOQ Q4 GDP printed at 1.7%, above the forecast of 1.5%.
- Despite the QoQ increase, Q4’s annualized US GDP slipped back to 3.2% versus the forecast of 3.3% after downside revisions to 2023’s first-quarter growth.
- German Retail Sales are expected to recover slightly, forecast to print at -1.5% YoY compared to the previous period’s -1.7%.
- Germany’s YoY CPI is forecast to come in at 2.6%, down from the previous 2.9%.
- February’s Core annualized US PCE is expected to come in at 2.8% YoY versus the previous print of 2.9%.
Euro price today
The table below shows the percentage change of Euro (EUR) against listed major currencies today. Euro was the weakest against the US Dollar.
| USD | EUR | GBP | CAD | AUD | JPY | NZD | CHF | |
| USD | 0.09% | 0.21% | 0.35% | 0.80% | 0.14% | 1.26% | 0.03% | |
| EUR | -0.07% | 0.14% | 0.27% | 0.74% | 0.06% | 1.19% | -0.05% | |
| GBP | -0.22% | -0.14% | 0.14% | 0.60% | -0.09% | 1.05% | -0.20% | |
| CAD | -0.35% | -0.28% | -0.14% | 0.45% | -0.22% | 0.91% | -0.30% | |
| AUD | -0.82% | -0.74% | -0.60% | -0.46% | -0.69% | 0.46% | -0.80% | |
| JPY | -0.13% | -0.06% | 0.08% | 0.22% | 0.68% | 1.15% | -0.11% | |
| NZD | -1.27% | -1.20% | -1.08% | -0.93% | -0.46% | -1.20% | -1.29% | |
| CHF | -0.03% | 0.07% | 0.19% | 0.33% | 0.76% | 0.11% | 1.24% |
The heat map shows percentage changes of major currencies against each other. The base currency is picked from the left column, while the quote currency is picked from the top row. For example, if you pick the Euro from the left column and move along the horizontal line to the Japanese Yen, the percentage change displayed in the box will represent EUR (base)/JPY (quote).
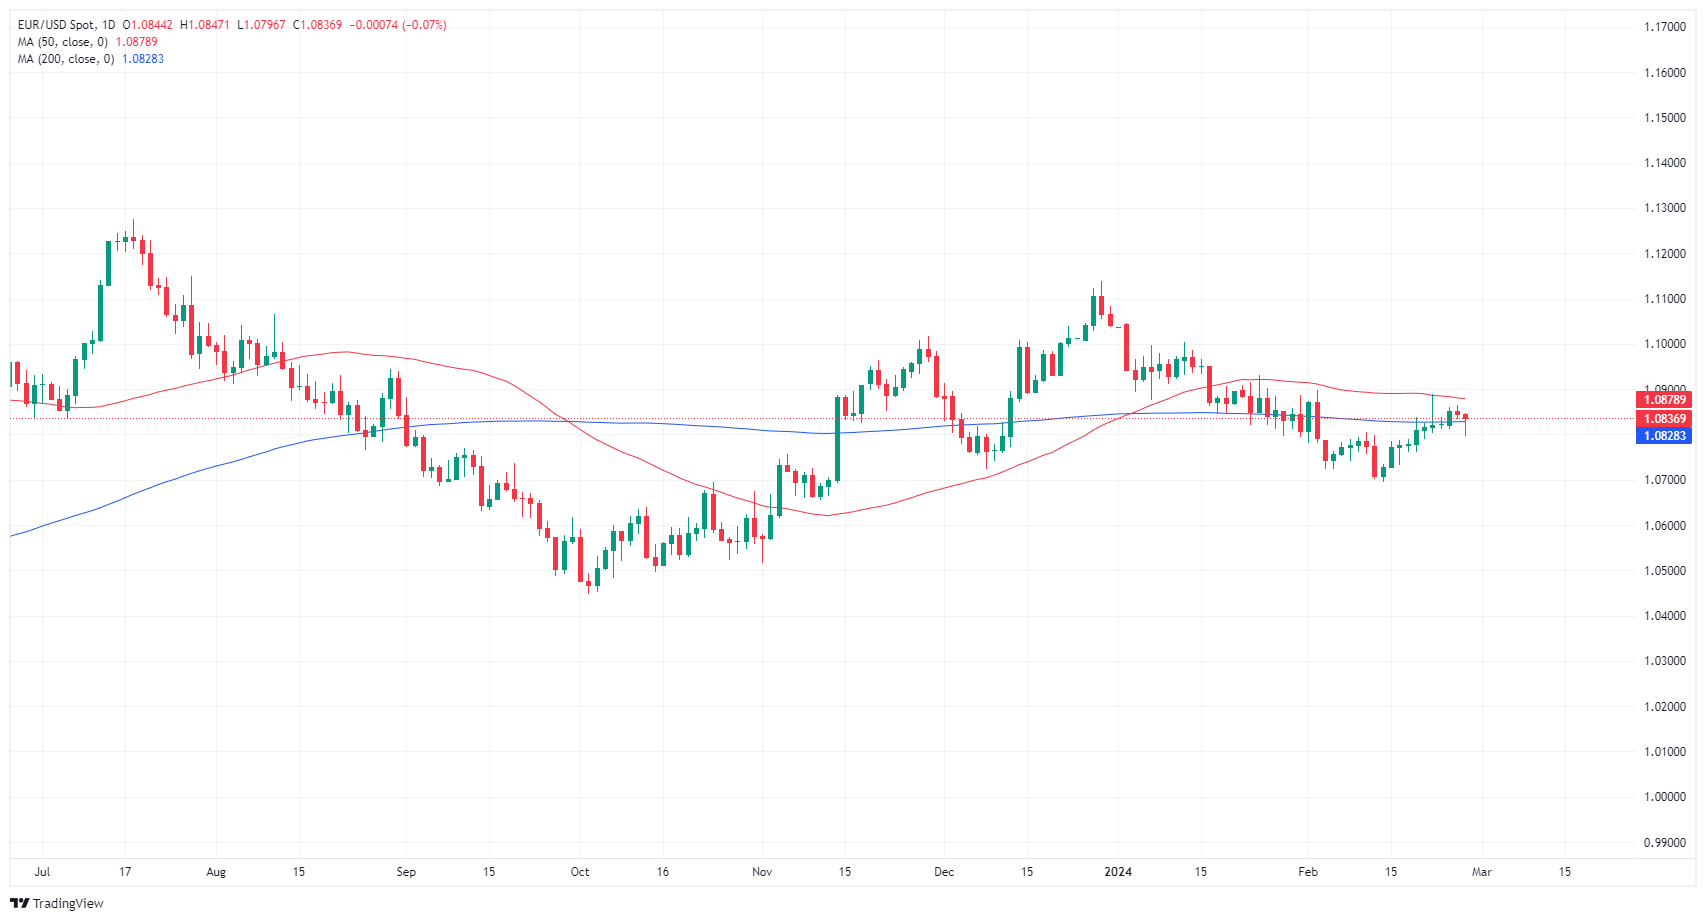
Technical analysis: EUR/USD continues to drift around 1.0800
EUR/USD fell to an intraday low of 1.0796 before recovering into familiar technical churn as the pair cycles 1.0800. The 1.0840 level is the pair’s key sticking point on Wednesday. A heavy supply zone is priced in between 1.0860 and 1.0840.
Daily candlesticks remain hamstrung on the 200-day Simple Moving Average (SMA) near 1.0830, and the EUR/USD continues to drift into median bids despite a bullish recovery from the last swing low into 1.0700. The pair remains down nearly 3% from December’s peak at 1.1140.
EUR/USD hourly chart
EUR/USD daily chart![]()
Inflation FAQs
Inflation measures the rise in the price of a representative basket of goods and services. Headline inflation is usually expressed as a percentage change on a month-on-month (MoM) and year-on-year (YoY) basis. Core inflation excludes more volatile elements such as food and fuel which can fluctuate because of geopolitical and seasonal factors. Core inflation is the figure economists focus on and is the level targeted by central banks, which are mandated to keep inflation at a manageable level, usually around 2%.
The Consumer Price Index (CPI) measures the change in prices of a basket of goods and services over a period of time. It is usually expressed as a percentage change on a month-on-month (MoM) and year-on-year (YoY) basis. Core CPI is the figure targeted by central banks as it excludes volatile food and fuel inputs. When Core CPI rises above 2% it usually results in higher interest rates and vice versa when it falls below 2%. Since higher interest rates are positive for a currency, higher inflation usually results in a stronger currency. The opposite is true when inflation falls.
Although it may seem counter-intuitive, high inflation in a country pushes up the value of its currency and vice versa for lower inflation. This is because the central bank will normally raise interest rates to combat the higher inflation, which attract more global capital inflows from investors looking for a lucrative place to park their money.
Formerly, Gold was the asset investors turned to in times of high inflation because it preserved its value, and whilst investors will often still buy Gold for its safe-haven properties in times of extreme market turmoil, this is not the case most of the time. This is because when inflation is high, central banks will put up interest rates to combat it.
Higher interest rates are negative for Gold because they increase the opportunity-cost of holding Gold vis-a-vis an interest-bearing asset or placing the money in a cash deposit account. On the flipside, lower inflation tends to be positive for Gold as it brings interest rates down, making the bright metal a more viable investment alternative.
Read the full article here