- USD/CAD flubs 1.3600 once again.
- Canada Manufacturing PMI recovers but still in contraction.
- US ISM Manufacturing PMI declined, flaunting forecasts.
USD/CAD fumbled the 1.3600 handle on Friday after a worse-than-expected US ISM Manufacturing Purchasing Managers Index (PMI) for February unexpectedly declined. The US Dollar (USD) was dragged broadly lower, sending the USD/CAD pair back into familiar technical territory near 1.3550.
Canada saw a decline in its S&P Global Manufacturing PMI on Friday, but market attention was focused on the day’s key US data print. Next week brings the latest rate call from the Bank of Canada (BoC) slated for next Wednesday, and next week will wrap up with another US Nonfarm Payrolls (NFP) on Friday alongside Canadian labor figures.
Daily digest market movers: USD/CAD falls back into range after ISM PMI miss
- Canada’s S&P Global Manufacturing PMI for February printed at 49.7 compared to the previous 48.3, an improvement but still in contraction territory below 50.0.
- The US ISM Manufacturing PMI for February fell to 47.8 versus the forecasted uptick to 49.5 from 49.1.
- ISM Manufacturing PMI: declines to 47.8 in February vs. 49.5 expected.
- The University of Michigan Consumer Sentiment survey index also eased to 76.9 in February, down from the forecast of a hold at the previous 79.6.
- ISM Manufacturing Prices Paid also ticked lower to 52.5, down from the 53.0 forecast and the previous month’s 52.9.
- Easing data is sparking investor risk appetite as inflation figures up odds of a Federal Reserve (Fed) rate cut.
- Fed’s Monetary Policy Report: Inflation expectations are broadly consistent with 2% goal
Canadian Dollar price today
The table below shows the percentage change of Canadian Dollar (CAD) against listed major currencies today. Canadian Dollar was the weakest against the Australian Dollar.
| USD | EUR | GBP | CAD | AUD | JPY | NZD | CHF | |
| USD | -0.23% | -0.16% | -0.14% | -0.47% | 0.07% | -0.31% | 0.01% | |
| EUR | 0.25% | 0.09% | 0.09% | -0.22% | 0.33% | -0.07% | 0.26% | |
| GBP | 0.16% | -0.08% | -0.01% | -0.31% | 0.24% | -0.14% | 0.17% | |
| CAD | 0.14% | -0.06% | 0.02% | -0.28% | 0.24% | -0.14% | 0.17% | |
| AUD | 0.47% | 0.23% | 0.30% | 0.28% | 0.55% | 0.16% | 0.48% | |
| JPY | -0.08% | -0.31% | -0.23% | -0.24% | -0.54% | -0.37% | -0.06% | |
| NZD | 0.31% | 0.07% | 0.12% | 0.15% | -0.16% | 0.38% | 0.28% | |
| CHF | -0.01% | -0.25% | -0.17% | -0.18% | -0.48% | 0.07% | -0.32% |
The heat map shows percentage changes of major currencies against each other. The base currency is picked from the left column, while the quote currency is picked from the top row. For example, if you pick the Euro from the left column and move along the horizontal line to the Japanese Yen, the percentage change displayed in the box will represent EUR (base)/JPY (quote).
Technical analysis: USD/CAD drifts back into the bottom end of near-term congestion below 1.3600
USD/CAD fell from an intraday high near 1.3600 to retest 1.3550 on Friday as the pair continues to grapple with near-term consolidation. A heavy supply zone at the 1.3600 handle is keeping bullish momentum pinned.
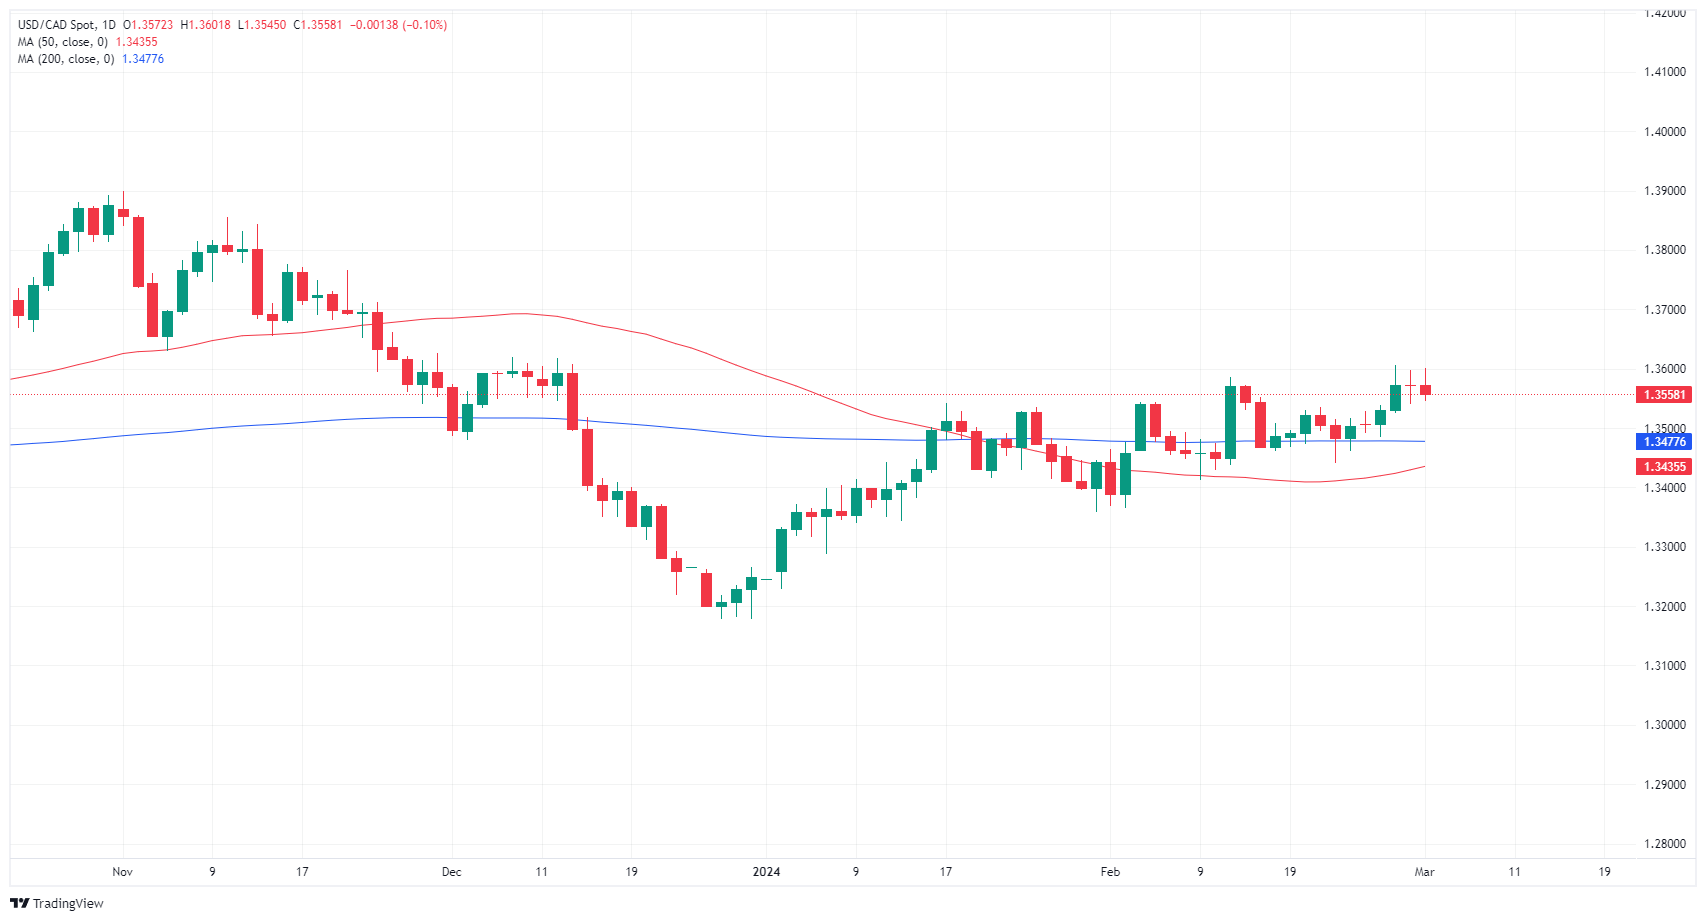
Higher highs are keeping daily candlesticks on the bullish side, but USD/CAD continues to wrestle with the 200-day Simple Moving Average (SMA) at 1.3477. A lack of topside momentum could drag the pair back into consolidation at the long-term moving average if buyers can’t break the 1.3600 level decisively.
USD/CAD hourly chart
USD/CAD daily chart![]()
Inflation FAQs
Inflation measures the rise in the price of a representative basket of goods and services. Headline inflation is usually expressed as a percentage change on a month-on-month (MoM) and year-on-year (YoY) basis. Core inflation excludes more volatile elements such as food and fuel which can fluctuate because of geopolitical and seasonal factors. Core inflation is the figure economists focus on and is the level targeted by central banks, which are mandated to keep inflation at a manageable level, usually around 2%.
The Consumer Price Index (CPI) measures the change in prices of a basket of goods and services over a period of time. It is usually expressed as a percentage change on a month-on-month (MoM) and year-on-year (YoY) basis. Core CPI is the figure targeted by central banks as it excludes volatile food and fuel inputs. When Core CPI rises above 2% it usually results in higher interest rates and vice versa when it falls below 2%. Since higher interest rates are positive for a currency, higher inflation usually results in a stronger currency. The opposite is true when inflation falls.
Although it may seem counter-intuitive, high inflation in a country pushes up the value of its currency and vice versa for lower inflation. This is because the central bank will normally raise interest rates to combat the higher inflation, which attract more global capital inflows from investors looking for a lucrative place to park their money.
Formerly, Gold was the asset investors turned to in times of high inflation because it preserved its value, and whilst investors will often still buy Gold for its safe-haven properties in times of extreme market turmoil, this is not the case most of the time. This is because when inflation is high, central banks will put up interest rates to combat it.
Higher interest rates are negative for Gold because they increase the opportunity-cost of holding Gold vis-a-vis an interest-bearing asset or placing the money in a cash deposit account. On the flipside, lower inflation tends to be positive for Gold as it brings interest rates down, making the bright metal a more viable investment alternative.
Read the full article here