ETN Elliott Wave technical analysis
Function: Trend.
Mode: Impulsive.
Structure: Motive.
Position: Minor.
Direction: Upside within {v} of 5.
Details: We are looking for at least one more leg higher in wave (v) of {v} of 5 to then end a larger uptrend. Ideally the top of MG2 at around 380$ could provide resistance.
ETN Elliott Wave technical analysis – Daily chart
The daily chart indicates that Eaton is in the final stages of Minor wave 5, specifically in wave (v) of {v}. This suggests that at least one more leg higher is expected to complete the overall uptrend. The next significant resistance is projected to be around the Trading Level MG2, close to $380, where we could see a potential top form before a larger correction.
ETN Elliott Wave technical analysis
Function: Trend.
Mode: Impulsive.
Structure: Motive.
Position: Wave iii of (v).
Diection: Upside in wave (v).
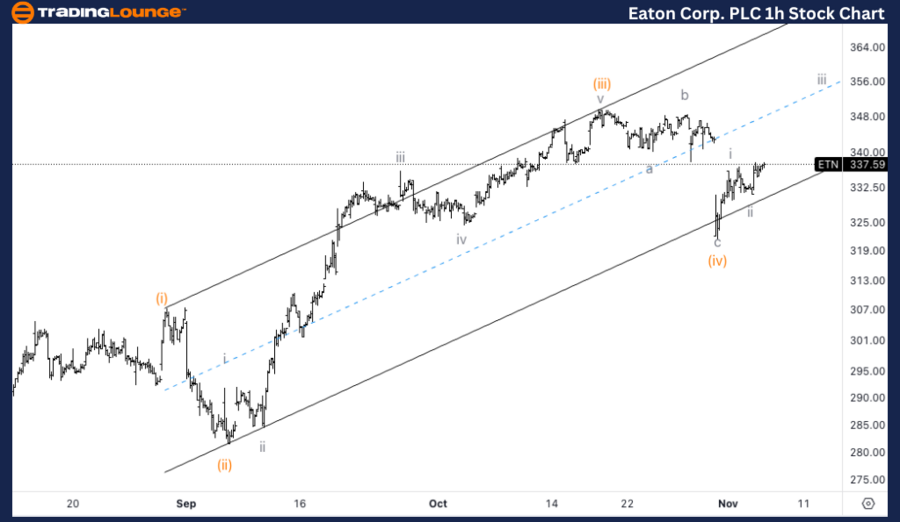
Details: Looking at a three wave move in what appears to be wave (iv) which also found support on top of the parallel trend channel. AS we are trading above MG1, we could expect 350 to be the next target.
ETN Elliott Wave technical analysis – One-hour chart
On the 1-hour chart, ETN is in the process of completing wave iii of (v). The market appears to be working through wave (iv), which has shown a three-wave corrective structure and found support along a parallel trend channel. As long as the price holds above Trading Level MG1, the next target to the upside is $350, as wave (v) continues to push higher.

This analysis focuses on the current trend structure of Eaton Corp PLC, (ETN) utilizing the Elliott Wave Theory on both the daily and 1-hour charts. Below is a breakdown of the stock’s position and potential future movements.
Eaton Corp PLC (ETN) Elliott Wave technical analysis [Video]
Read the full article here

