
Key points:
-
Bitcoin has been lagging gold and the S&P 500 since November, but analysts expect a rally to a new all-time high in 2026.
-
Several major altcoins are showing signs of starting a short-term recovery.
Bitcoin (BTC) remains stuck inside the $86,400 to $90,600 range, indicating a balance between supply and demand.
BTC has been a laggard to other asset classes, such as gold and the S&P 500, since November, but market intelligence platform Santiment said in a post on X that there is “an opportunity for crypto to play catch-up.”
Some analysts believe that BTC could benefit from increasing global liquidity in 2026. BitMEX cofounder Arthur Hayes said in a post on X that crypto could pump as dollar liquidity is moving higher after bottoming out in November.
Another positive sign is that several analysts believe BTC’s four-year cycle has broken. Analyst The ₿itcoin Therapist expects BTC to hit a new all-time high as early as the first quarter of 2026. Even more bullish are the Citigroup analysts who forecast a base case BTC price target of $143,000 and a bull case of $189,000 in 2026.
Could BTC and the major altcoins break above their overhead resistance levels? Let’s analyze the charts of the top 10 cryptocurrencies to find out.
Bitcoin price prediction
BTC has been witnessing a tough battle between the bulls and the bears near the 20-day exponential moving average ($88,439).
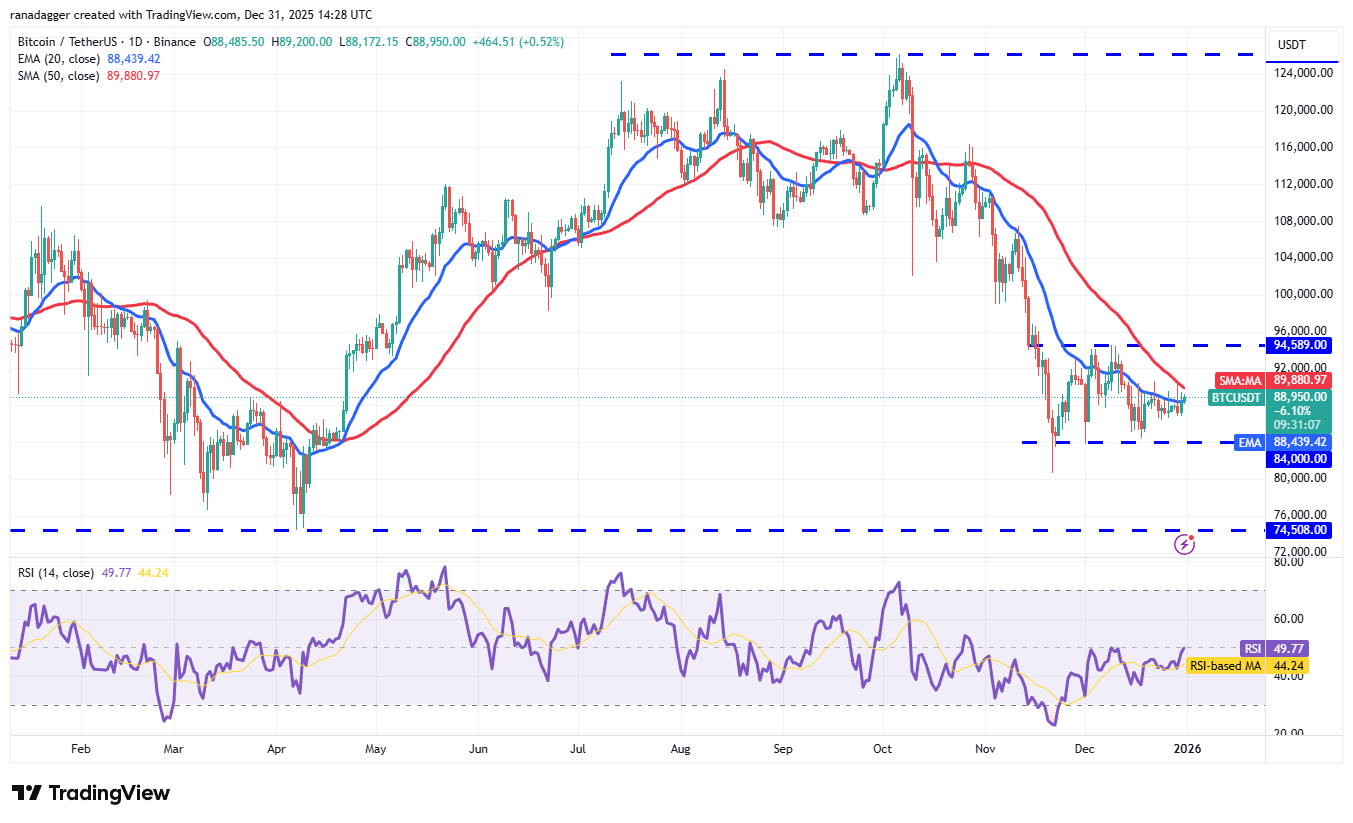
The tight consolidation just below the 20-day EMA increases the possibility of a break above the 50-day simple moving average ($89,880). If that happens, the BTC/USDT pair could ascend to the overhead resistance at $94,589.
This is a critical level to watch, as a break above it signals that the corrective phase may be over. The Bitcoin price could then rally to $100,000 and later to $107,500.
On the contrary, if the price turns down sharply from the moving averages, it suggests that the bears remain in command. That heightens the risk of a drop below the $84,000 support. The next stop on the downside is $80,600 and then $74,508.
Ether price prediction
Ether (ETH) bulls are attempting to start a relief rally by pushing the price above the 50-day SMA ($3,019).
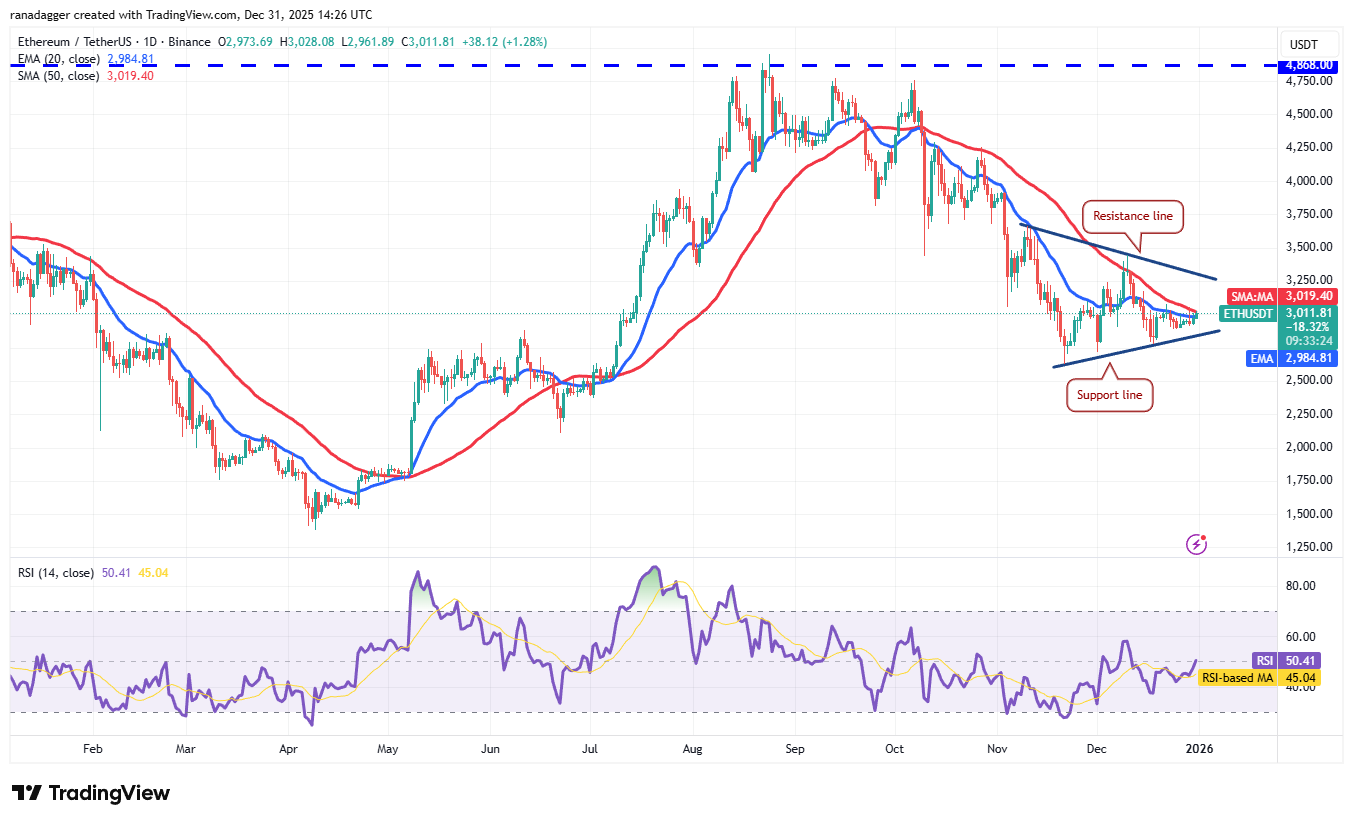
A close above the 50-day SMA clears the path for a rally to the resistance line of the symmetrical triangle pattern. Buyers will have to propel the Ether price above the resistance line to suggest that the downtrend could be over. The ETH/USDT pair may then attempt a rally to $4,000.
On the downside, a close below the support line signals that the bears have overpowered the bulls. The pair may collapse to $2,623 and thereafter to $2,373.
BNB price prediction
Buyers are attempting to drive BNB (BNB) above the 50-day SMA ($876), indicating demand at higher levels.
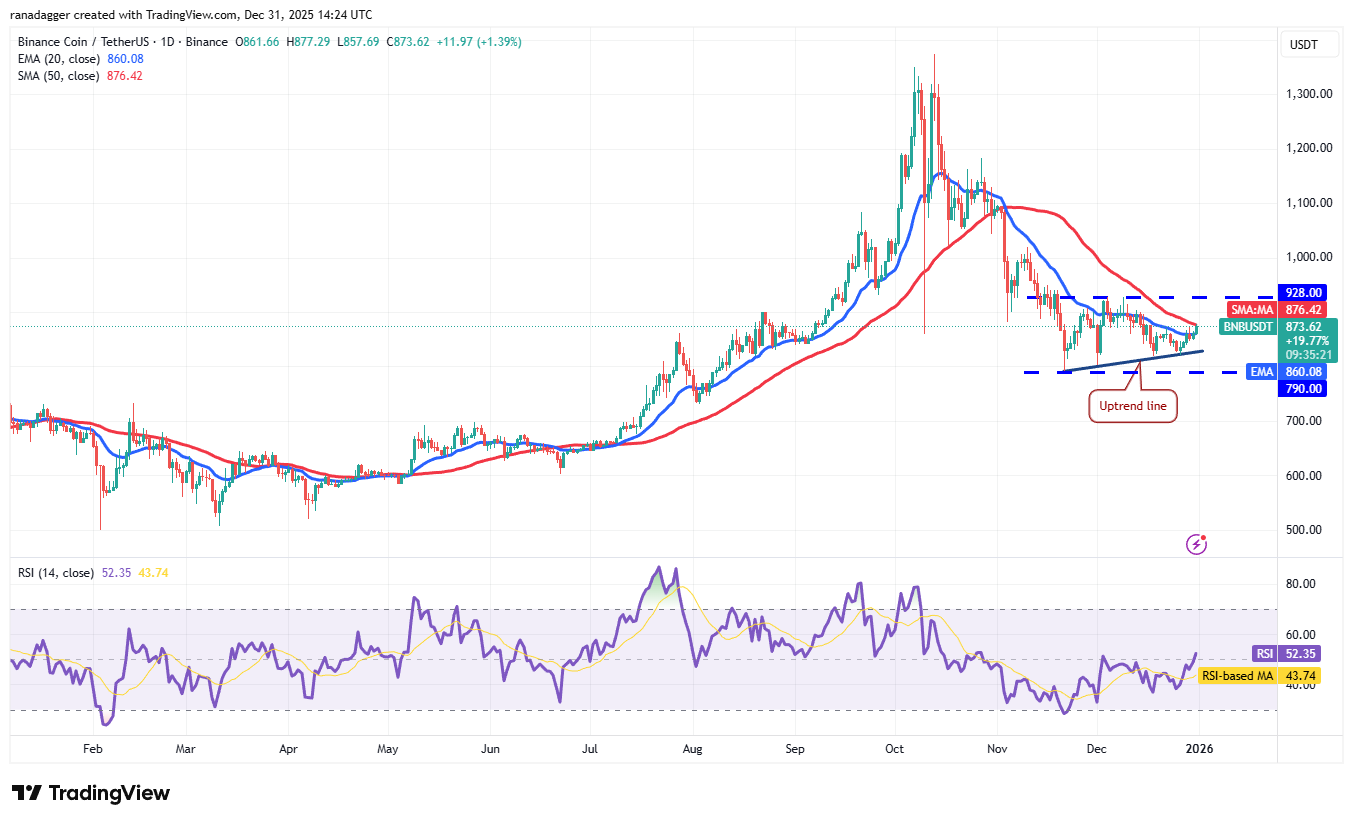
A close above the 50-day SMA opens the doors for a rally to the stiff overhead resistance of $928. Sellers are expected to pose a strong challenge at the $928 level, as a close above it completes a bullish ascending triangle pattern. The BNB/USDT pair may then rally toward the pattern target of $1,066.
Alternatively, if the BNB price turns down sharply from $928, it suggests that the bears are active at higher levels. The pair may then extend its stay inside the $928 to $790 range for a few more days.
XRP price prediction
Buyers are attempting to start a recovery in XRP (XRP) by pushing the price above the 20-day EMA ($1.91).
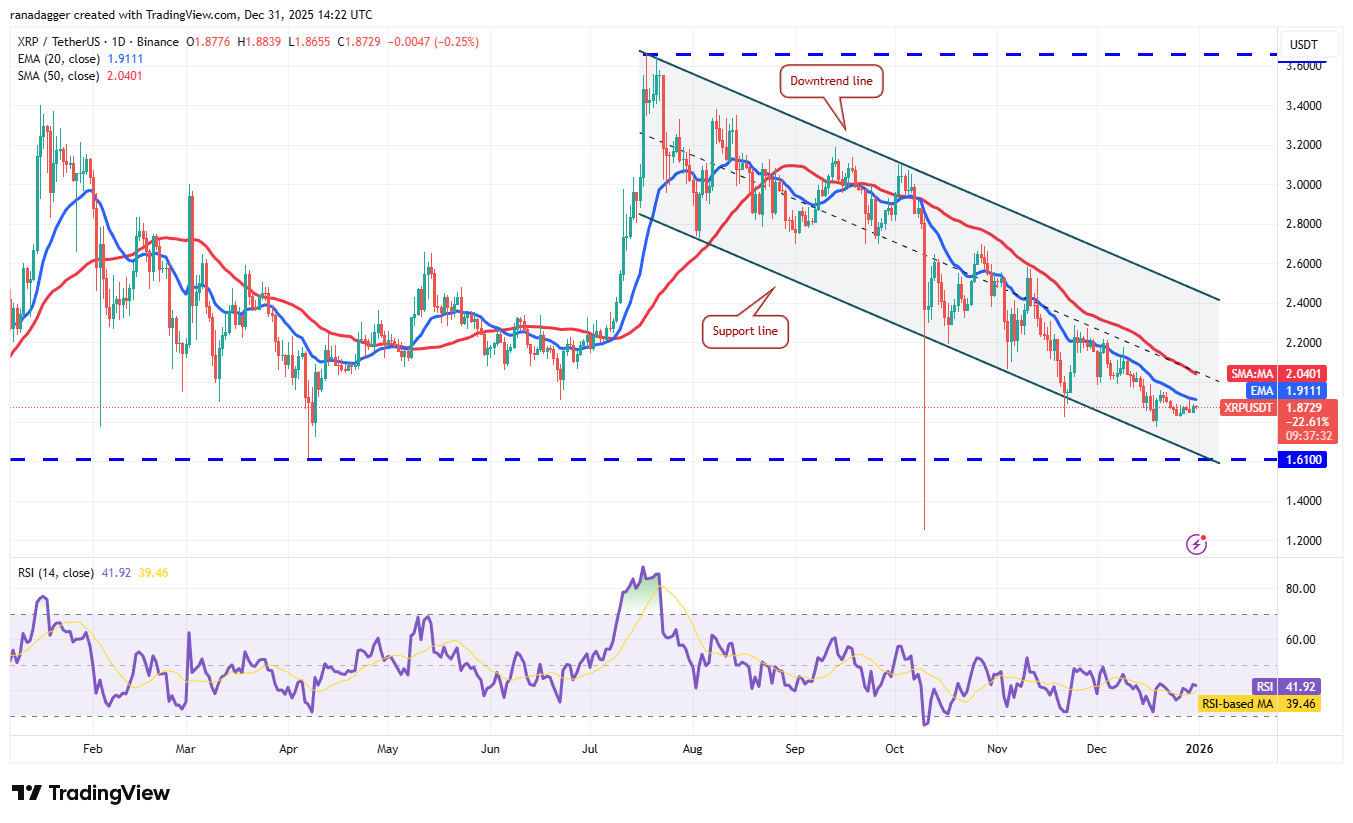
If they succeed, the XRP/USDT pair could rise to the 50-day SMA ($2.04) and, after that, to the downtrend line. Sellers are expected to fiercely defend the downtrend line, as a close above it signals a potential trend change. The pair could then rally to $2.70.
The $1.61 level is the critical support to watch on the downside. A close below the level signals the start of the next leg of the downtrend. The XRP price may then nosedive to the Oct. 10 low of $1.25.
Solana price prediction
Solana (SOL) has been clinging to the 20-day EMA ($126) for the past few days, indicating that the bulls continue to exert pressure.
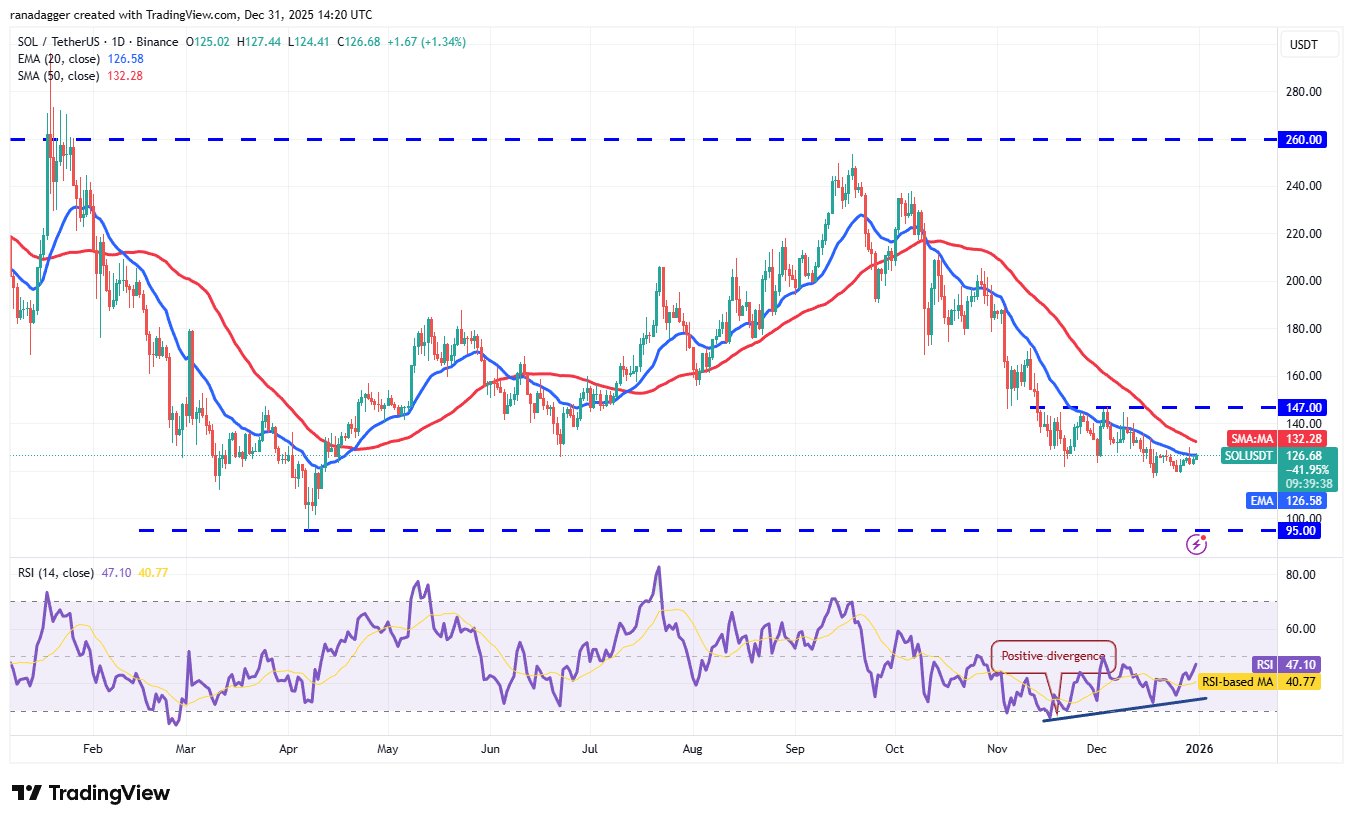
If the price closes above the 20-day EMA, the SOL/USDT pair could climb to the overhead resistance at $147. There is minor resistance at the 50-day SMA ($132), but it is likely to be crossed.
Contrarily, if the Solana price turns down from the moving averages, it signals that the bears remain in control. That heightens the risk of a drop to the $108 level and eventually to the critical support at $95.
Dogecoin price prediction
Buyers are struggling to push Dogecoin (DOGE) above the breakdown level of $0.13, indicating a lack of demand at higher levels.
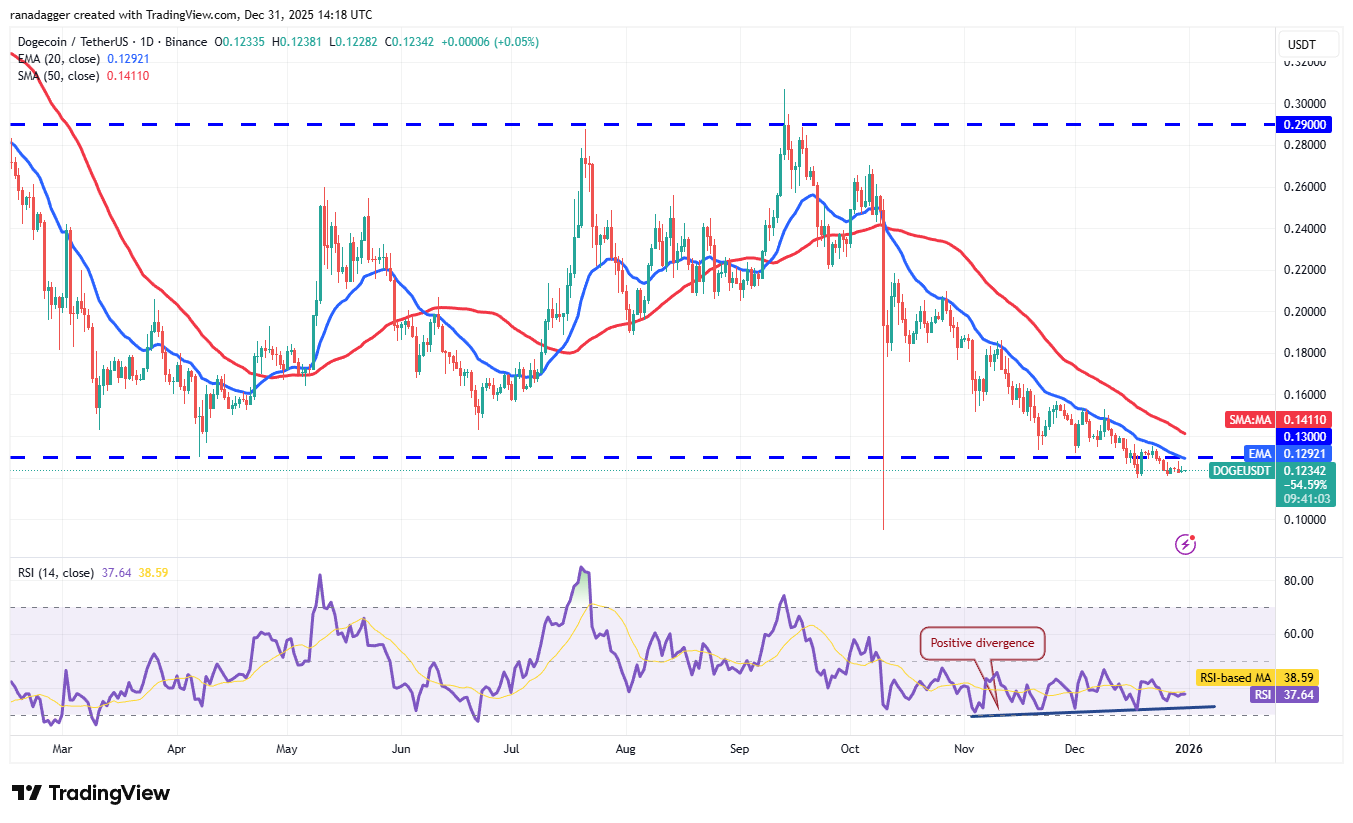
Sellers will attempt to sink the Dogecoin price below the $0.12 level. If they can pull it off, the downtrend could resume, and the DOGE/USDT pair could descend to the Oct. 10 low of $0.10.
Buyers will have to swiftly drive the price above the moving averages to prevent the downward move. The pair could then rally to $0.19, indicating that the market has rejected the break below the $0.13 support.
Cardano price prediction
Cardano (ADA) turned down from the 20-day EMA ($0.37) on Monday, indicating negative sentiment.

The bears will try to strengthen their position by pulling the price below the $0.34 level. If they succeed, the ADA/USDT pair could plummet to $0.30 and later to the Oct. 10 low of $0.27.
The first sign of strength will be a break and close above the 20-day EMA. The pair could then climb to the 50-day SMA ($0.41), where the bears are expected to mount a strong defense. If buyers overcome the barrier, the Cardano price could reach the breakdown level of $0.50.
Related: Ethereum below $3K: Low fees, weak ETF flows signal stagnation into 2026
Bitcoin Cash price prediction
Bitcoin Cash (BCH) is taking support at the 20-day EMA ($587), indicating that the bulls continue to buy on dips.
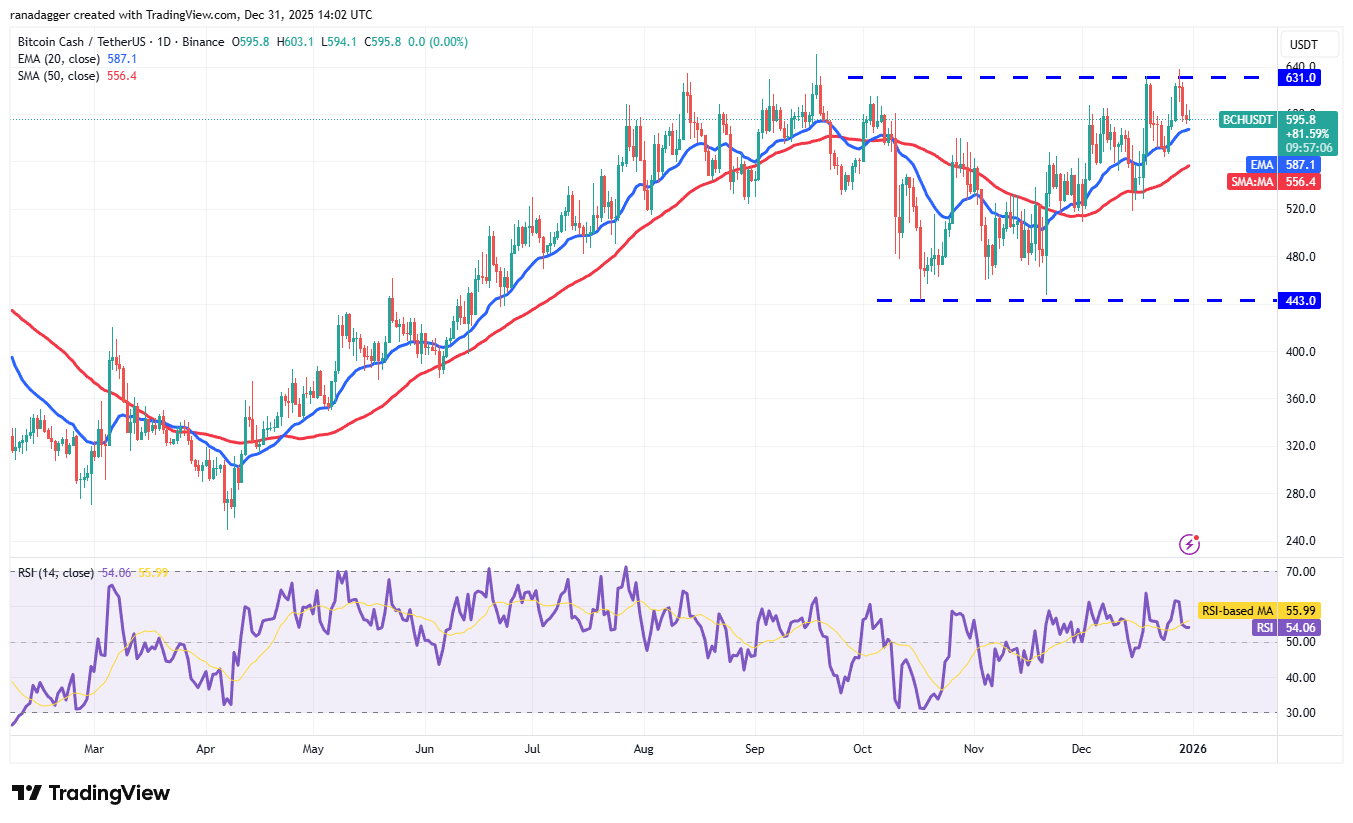
That enhances the prospects of a break above the $631 level. The BCH/USDT pair could then rally to $651 and subsequently to the stiff overhead resistance at $720.
Sellers are likely to have other plans. They will strive to pull the price below the 20-day EMA. If they do that, the pair could slump to the 50-day SMA ($556). This is a crucial level for the bulls to defend, as a close below it suggests the Bitcoin Cash price may swing between $443 and $631 for some time.
Chainlink price prediction
Chainlink (LINK) has been trading between the 50-day SMA ($13.15) and the $11.61 support for the past few days.

The positive divergence on the RSI suggests the selling pressure is reducing. That increases the possibility of a break above the 50-day SMA. The LINK/USDT pair may then rally to $15.01. A close above $15.01 indicates that the downtrend could be over.
Instead, if the Chainlink price turns down sharply from the moving averages and breaks below $11.61, it signals that the bears remain in control. The pair could then plunge below the $10.94 support, opening the door for a fall to the Oct. 10 low of $7.90.
Hyperliquid price prediction
Sellers are defending the 20-day EMA ($26.44) in Hyperliquid (HYPE), but a positive sign is that the bulls have not ceded much ground to the bears.

That increases the likelihood of a break above the 20-day EMA. If that happens, the HYPE/USDT pair could climb to the 50-day SMA ($30.74) and then to the breakdown level of $35.50.
This positive view will be invalidated in the near term if the Hyperliquid price turns down from the moving averages and breaks below the $22.19 level. The pair may then retest the Oct. 10 low of $20.82.
This article does not contain investment advice or recommendations. Every investment and trading move involves risk, and readers should conduct their own research when making a decision. While we strive to provide accurate and timely information, Cointelegraph does not guarantee the accuracy, completeness, or reliability of any information in this article. This article may contain forward-looking statements that are subject to risks and uncertainties. Cointelegraph will not be liable for any loss or damage arising from your reliance on this information.
This article does not contain investment advice or recommendations. Every investment and trading move involves risk, and readers should conduct their own research when making a decision. While we strive to provide accurate and timely information, Cointelegraph does not guarantee the accuracy, completeness, or reliability of any information in this article. This article may contain forward-looking statements that are subject to risks and uncertainties. Cointelegraph will not be liable for any loss or damage arising from your reliance on this information.
Read the full article here