Key points:
-
Bitcoin is facing resistance at $90,500, but a positive sign is that the bulls have kept up the pressure.
-
Several major altcoins are attempting to start a recovery, but are expected to face selling at higher levels.
Sellers are attempting to maintain Bitcoin (BTC) below the $90,500 level, but the bulls continue to exert pressure. Fundstrat managing partner Tom Lee said on CNBC that cryptocurrencies should rise on a weaker dollar, but traders have responded by continuing to pile into gold and silver. Lee suggested that crypto is likely to catch up after the gold and silver rally takes a break.
Market intelligence platform Santiment said in a post on X that social media witnessed more discussions about silver and gold compared to cryptocurrencies on most days of this month. The analysts added that retail traders seem to be open to jumping sectors “based on wherever the latest pumps appear.”
However, a positive sign in favor of the bulls is that February has seen only three negative monthly losses since 2013 and a median rise of 12.21%, according to Coinglass data. If history repeats, BTC may rally in February.
Could buyers push BTC and the major altcoins above their resistance levels? Let’s analyze the charts of the top 10 cryptocurrencies to find out.
Bitcoin price prediction
BTC’s relief rally has reached the moving averages, where the bears are expected to pose a strong challenge.
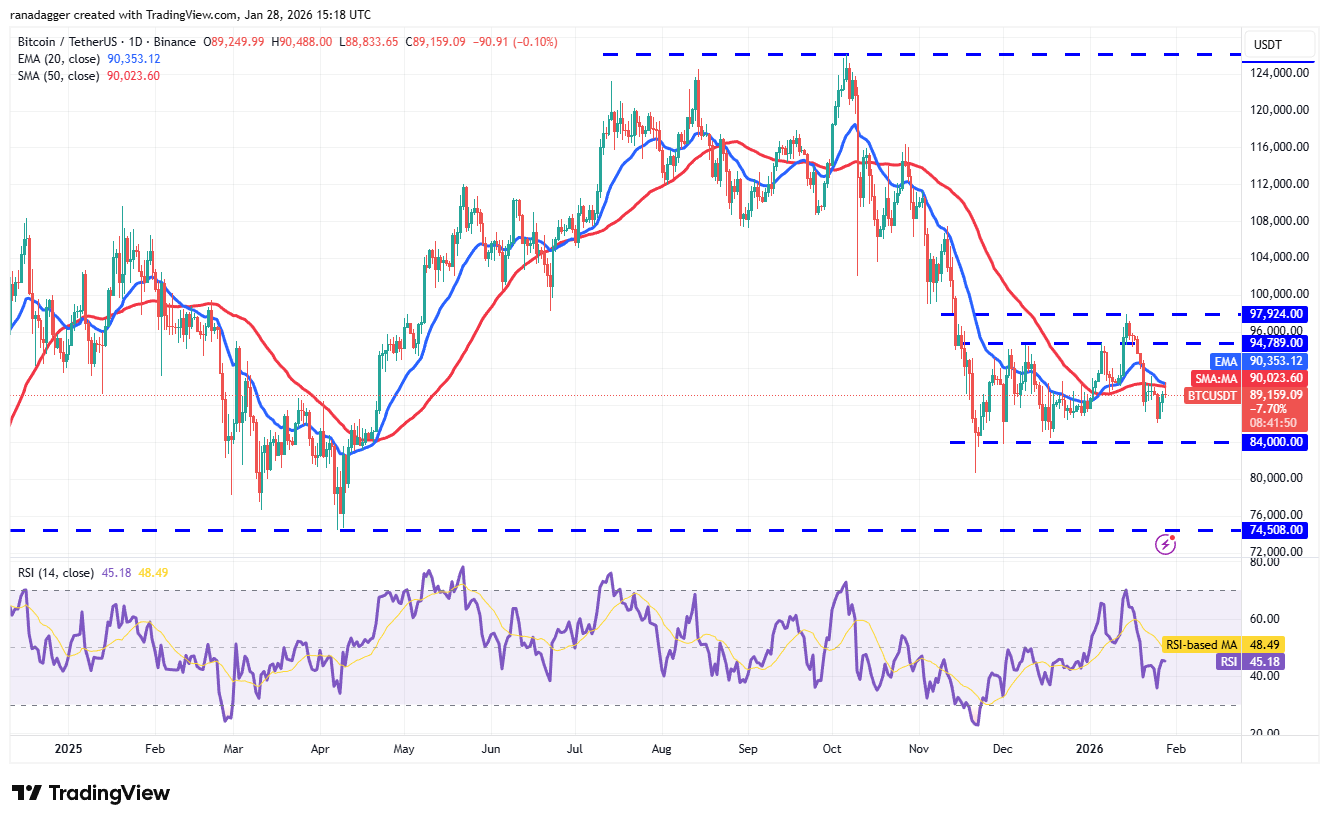
If the price turns down from the moving averages, the BTC/USDT pair may drop to the $84,000 support. Buyers are expected to defend the $84,000 level with all their might, as a close below it may sink the Bitcoin price to $80,600 and eventually to the formidable support at $74,508.
On the upside, a break and close above the moving averages opens the gates for a rally to the $94,789 to $97,924 resistance zone. A close above the resistance zone signals that the corrective phase may be over.
Ether price prediction
Ether (ETH) re-entered the symmetrical triangle pattern on Tuesday, but the recovery is facing resistance at the moving averages.
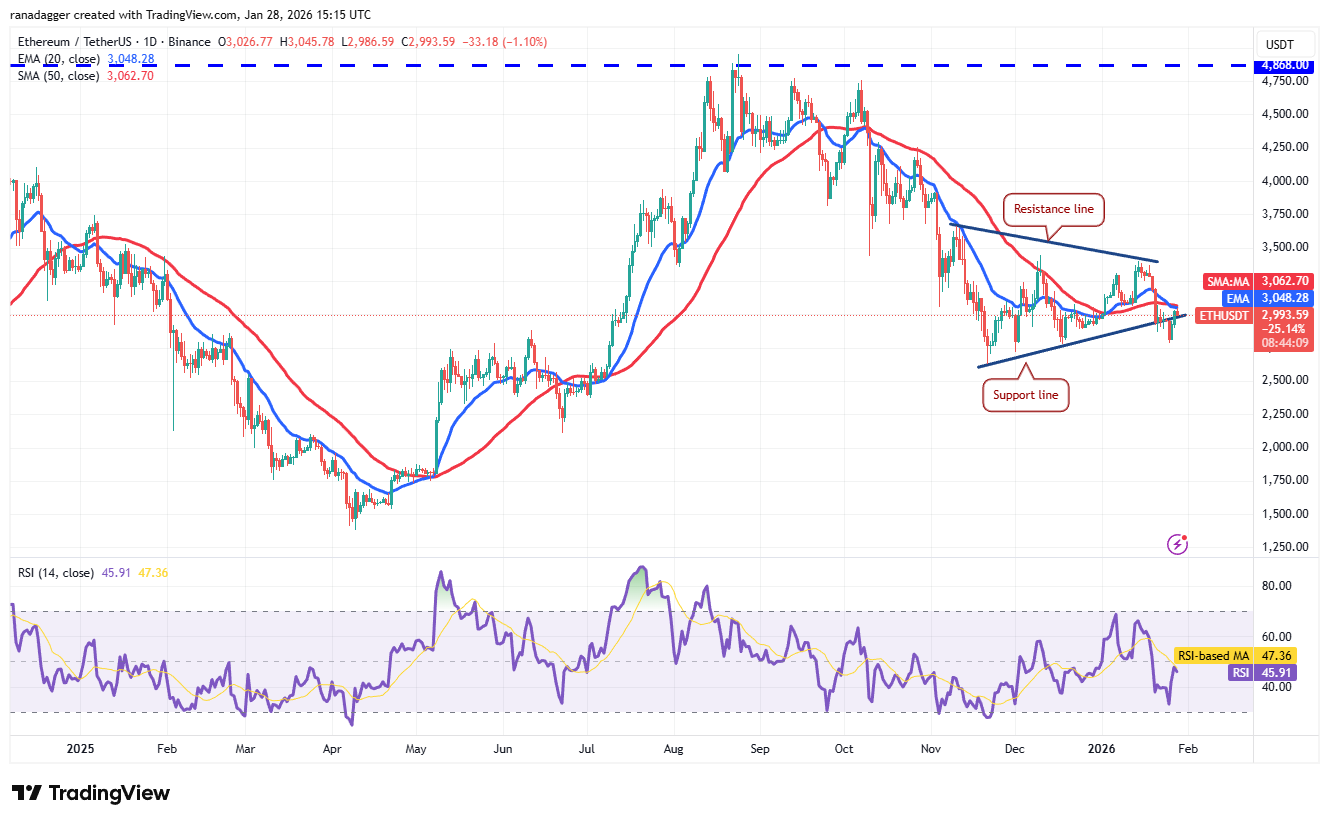
If the price turns down sharply from the moving averages, the bears will attempt to pull the ETH/USDT pair below the $2,787 level. If they succeed, the Ether price might plunge to $2,623.
Conversely, a close above the moving averages suggests that the market has rejected the breakdown below the support line. That improves the prospects of a break above the resistance line. The pair may then march toward $3,659.
BNB price prediction
BNB (BNB) is attempting to rise above the 20-day exponential moving average ($897), indicating demand at lower levels.
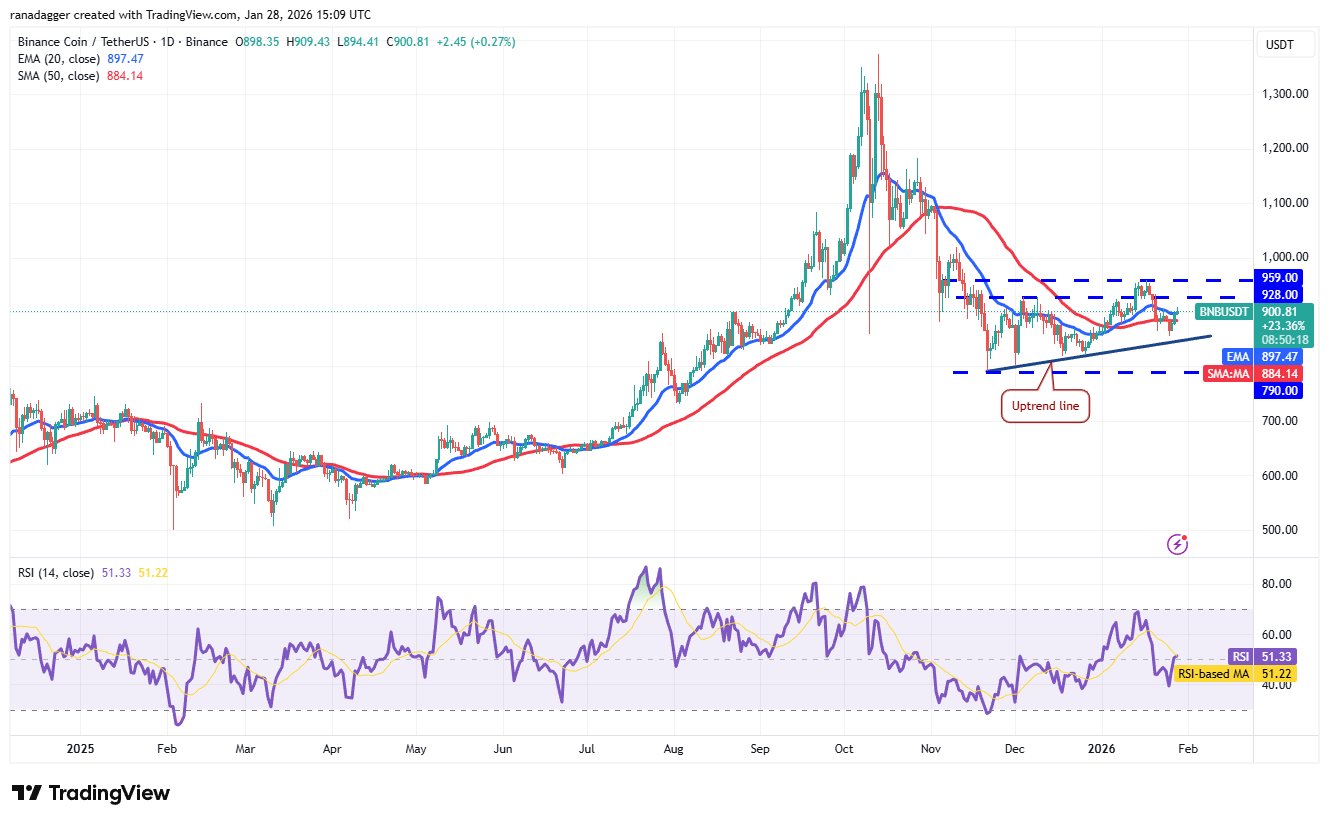
The BNB/USDT pair might reach the $928 to $959 overhead resistance zone, where the bears are expected to mount a solid defense. If buyers overcome the zone, the BNB price may start a rally to $1,020.
Sellers will have to pull the price below the uptrend line to gain the upper hand. If they manage to do that, the pair might slide to the $790 support. The bulls are expected to vigorously defend the $790 level, as a close below it may resume the downtrend.
XRP price prediction
Buyers are attempting to push XRP (XRP) above the moving averages, but the bears have held their ground.
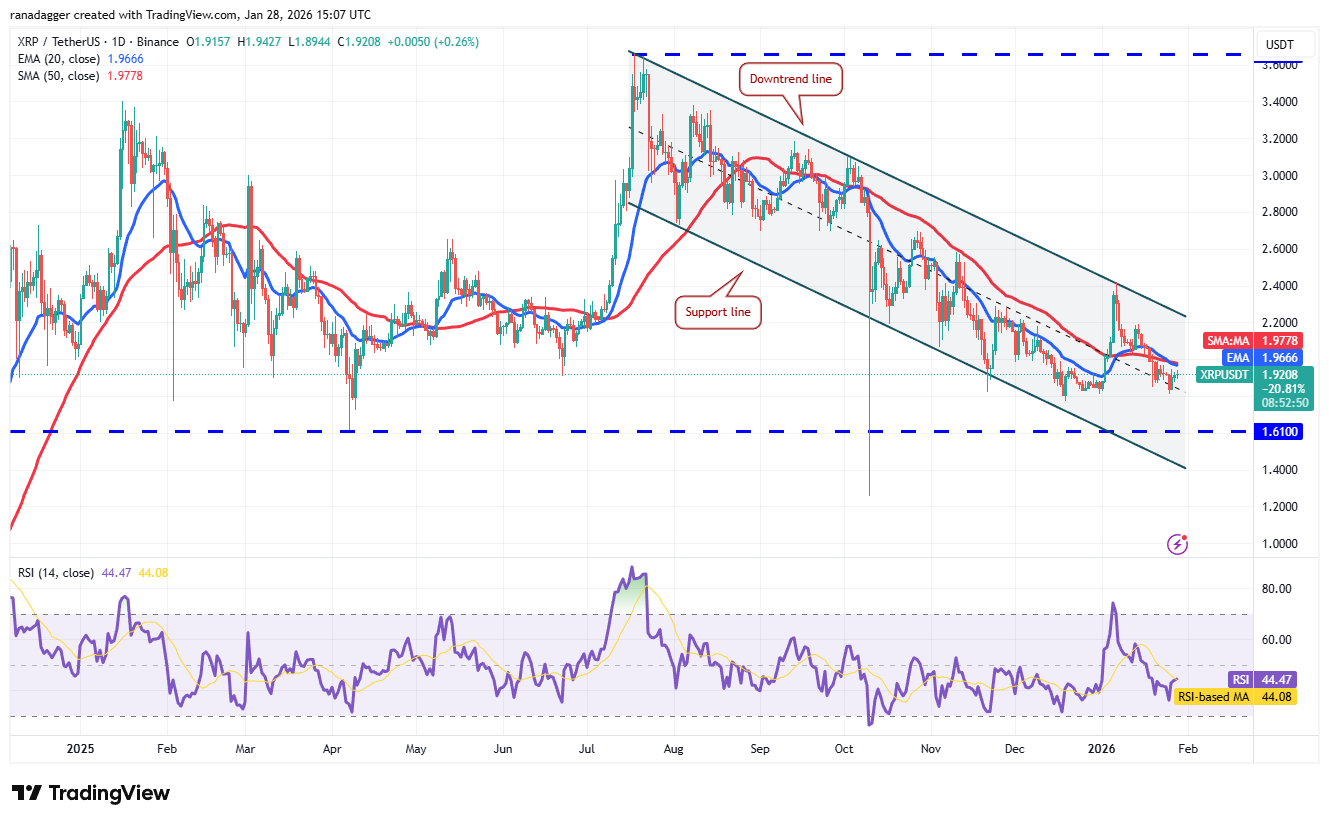
Sellers will attempt to pull the XRP price below the $1.77 level. If they can pull it off, the XRP/USDT pair may descend to the vital support at $1.61. Buyers are expected to fiercely defend the zone between the support line of the descending channel pattern and the $1.61 level.
If buyers push the price above the moving averages, the pair may reach the downtrend line. The bulls will have to achieve a close above the downtrend line to indicate the start of a new up move.
Solana price prediction
Solana (SOL) turned up from the $117 support on Monday, but the relief rally is likely to face selling at the moving averages.
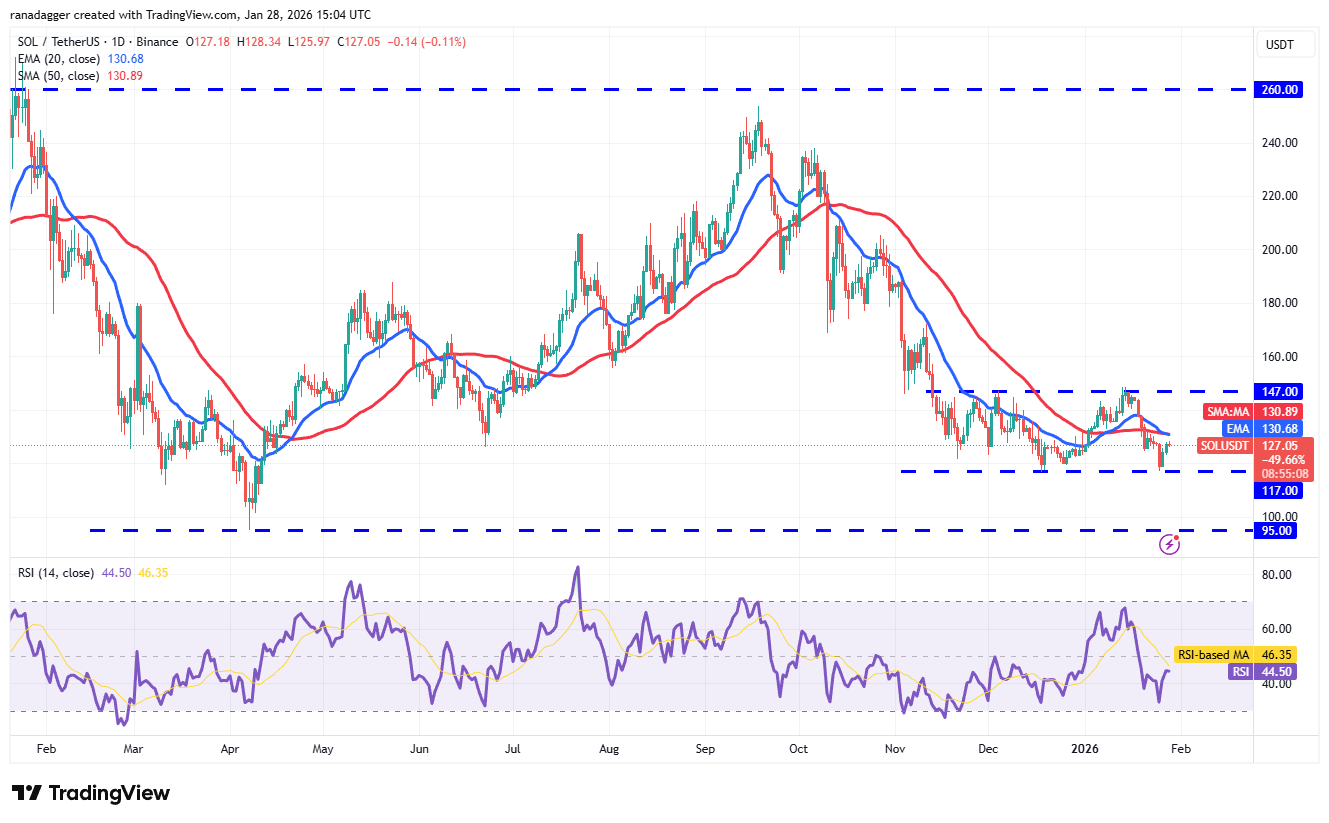
If the price turns down from the moving averages, the bears will again attempt to sink the SOL/USDT pair below $117. If they manage to do that, the Solana price may tumble to solid support at $95.
Alternatively, a break above the moving averages opens the doors for a rally to the $147 overhead resistance. Buyers will have to clear the $147 level barrier to suggest that the corrective phase may be over.
Dogecoin price prediction
Dogecoin (DOGE) has bounced off the $0.12 support, but the relief rally is expected to face selling at the moving averages.
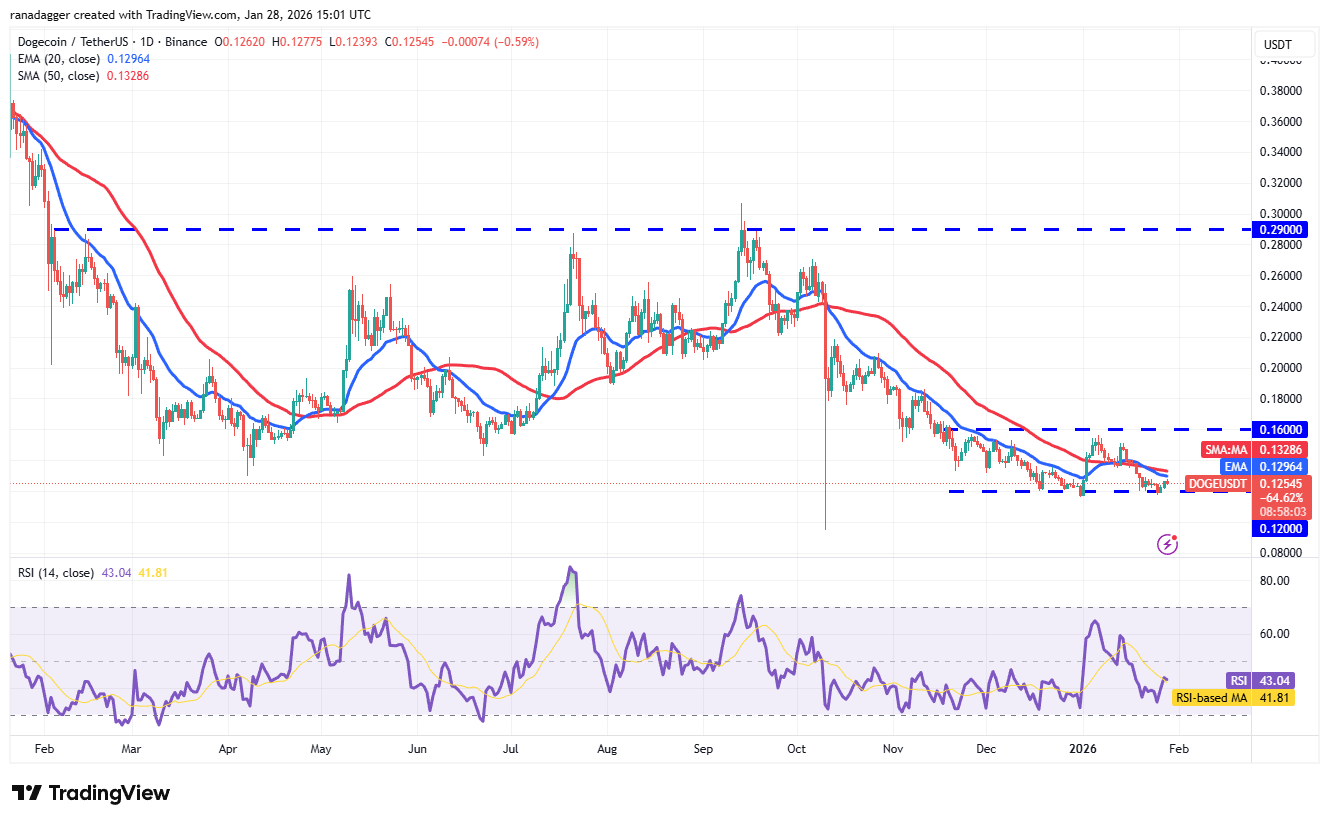
If the price turns down sharply from the moving averages, it heightens the risk of a break below the $0.12 support. The DOGE/USDT pair may then collapse to the Oct. 10, 2025, low of $0.10.
Contrarily, a break and close above the moving averages points to a possible range-bound action in the near term. The Dogecoin price may swing between $0.12 and $0.16 for some time. A short-term trend change will be signaled on a close above $0.16.
Cardano price prediction
Cardano’s (ADA) bounce off the $0.33 level has reached the moving averages, where the bears are expected to step in.
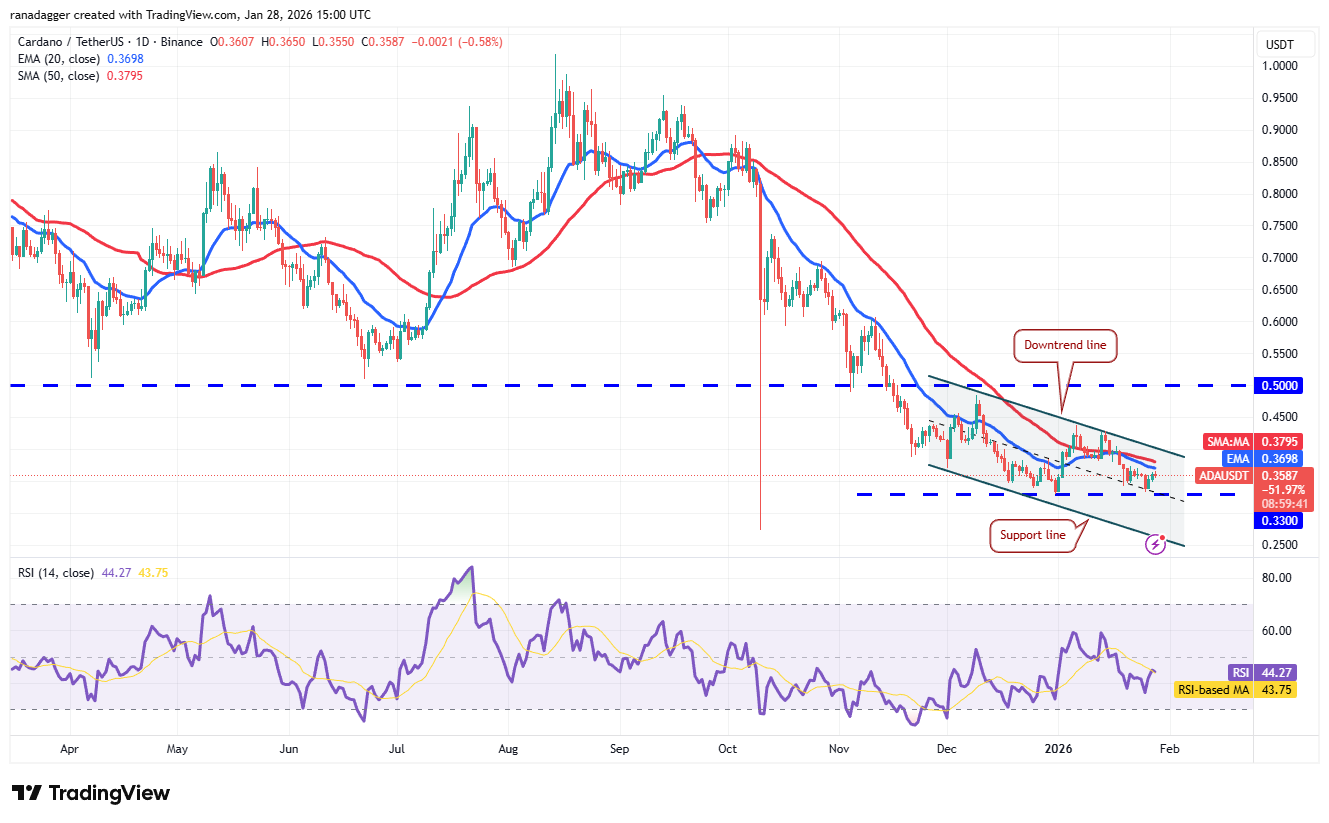
If the price turns down sharply from the moving averages, the likelihood of a break below the $0.33 level increases. The ADA/USDT pair may then plummet to the support line of the descending channel pattern.
This negative view will be invalidated in the near term if the Cardano price continues higher and breaks above the downtrend line. The pair may then rally to the breakdown level of $0.50, where the bears are expected to mount a strong defense.
Related: Bitcoin eyes $90K ahead of FOMC: Watch these BTC price levels next
Bitcoin Cash price prediction
Bitcoin Cash (BCH) again rebounded off the $563 support on Sunday, indicating that the bulls are aggressively defending the level.
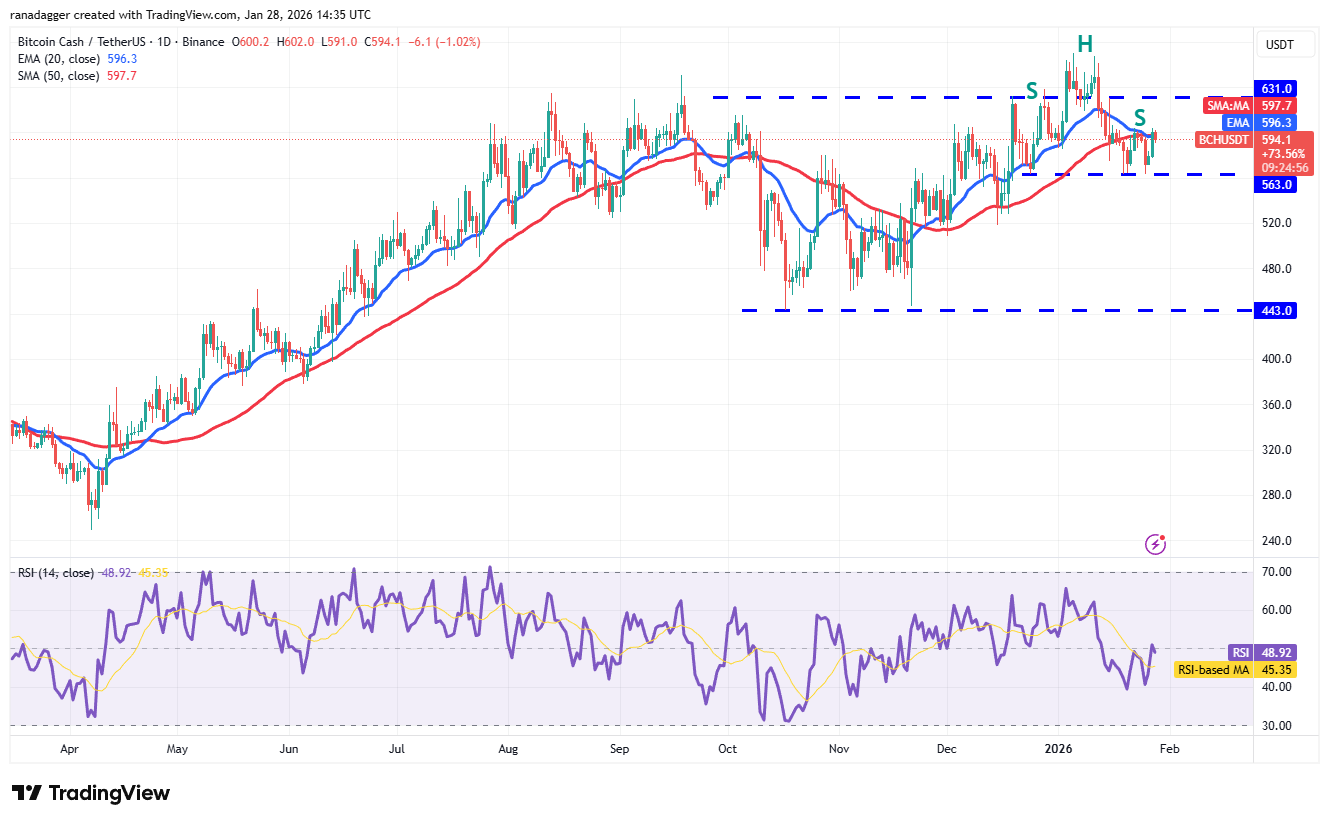
The moving averages are flattening out, and the RSI is near the midpoint, signaling a balance between supply and demand. If the price breaks above the moving averages, the advantage will tilt in favor of the bulls. The BCH/USDT pair may then ascend to $631 and later to $670.
Sellers will have to tug the Bitcoin Cash price below the $563 level to complete a bearish head-and-shoulders pattern. The pair may then tumble to $518 and subsequently to the pattern target of $456.
Hyperliquid price prediction
Hyperliquid (HYPE) turned up from the $20.82 support on Jan. 21 and soared above the 50-day SMA ($25.50) on Tuesday, indicating solid buying at lower levels.
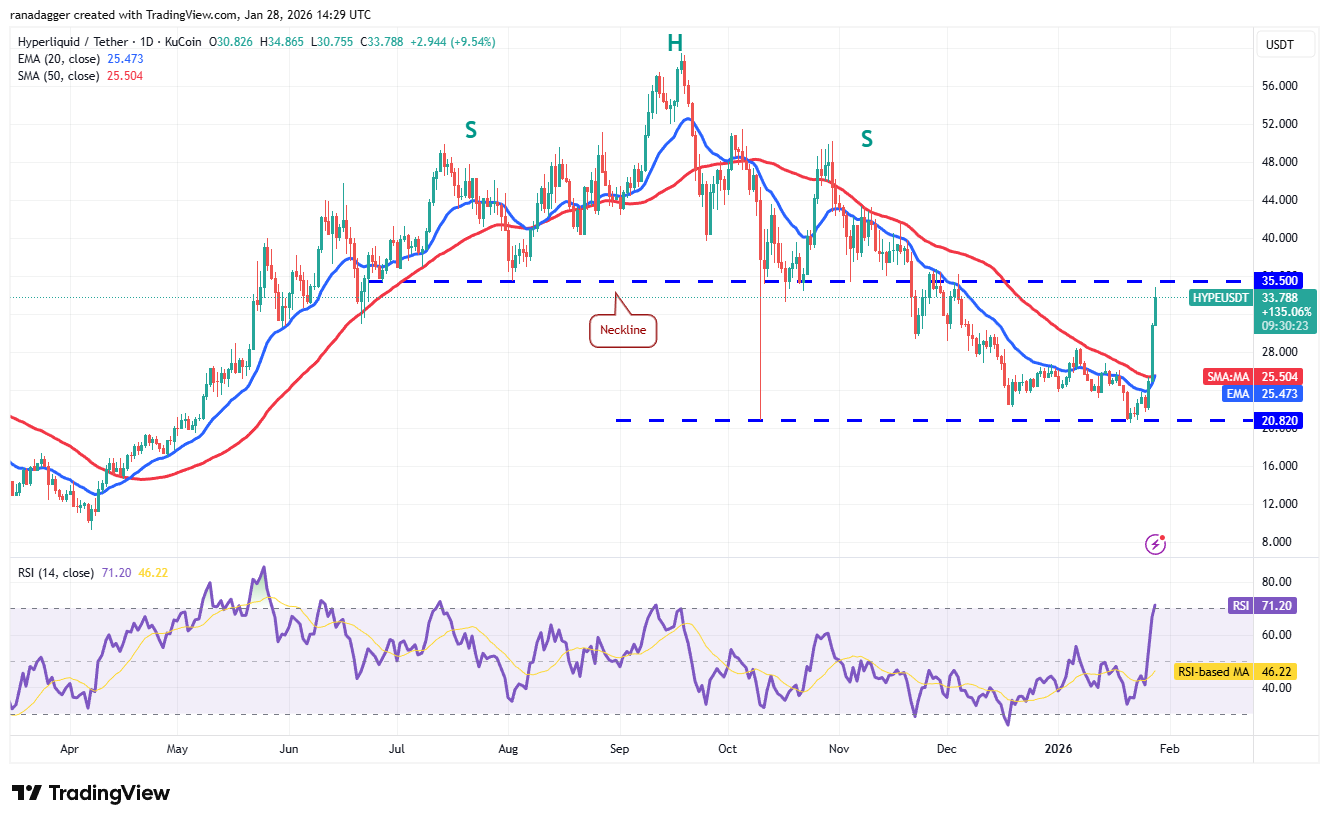
The moving averages are on the verge of completing a bullish crossover, and the RSI has jumped into the overbought zone, signaling that the bulls are back in the game. There is resistance at the breakdown level of $35.50, but if the buyers overcome it, the HYPE/USDT pair may ascend to $44.
Sellers will have to defend the $35.50 level and yank the Hyperliquid price below the moving averages to weaken the bullish momentum.
Monero price prediction
Monero’s (XMR) pullback is facing resistance at the 50-day SMA ($480), indicating that the bears are selling on minor rallies.
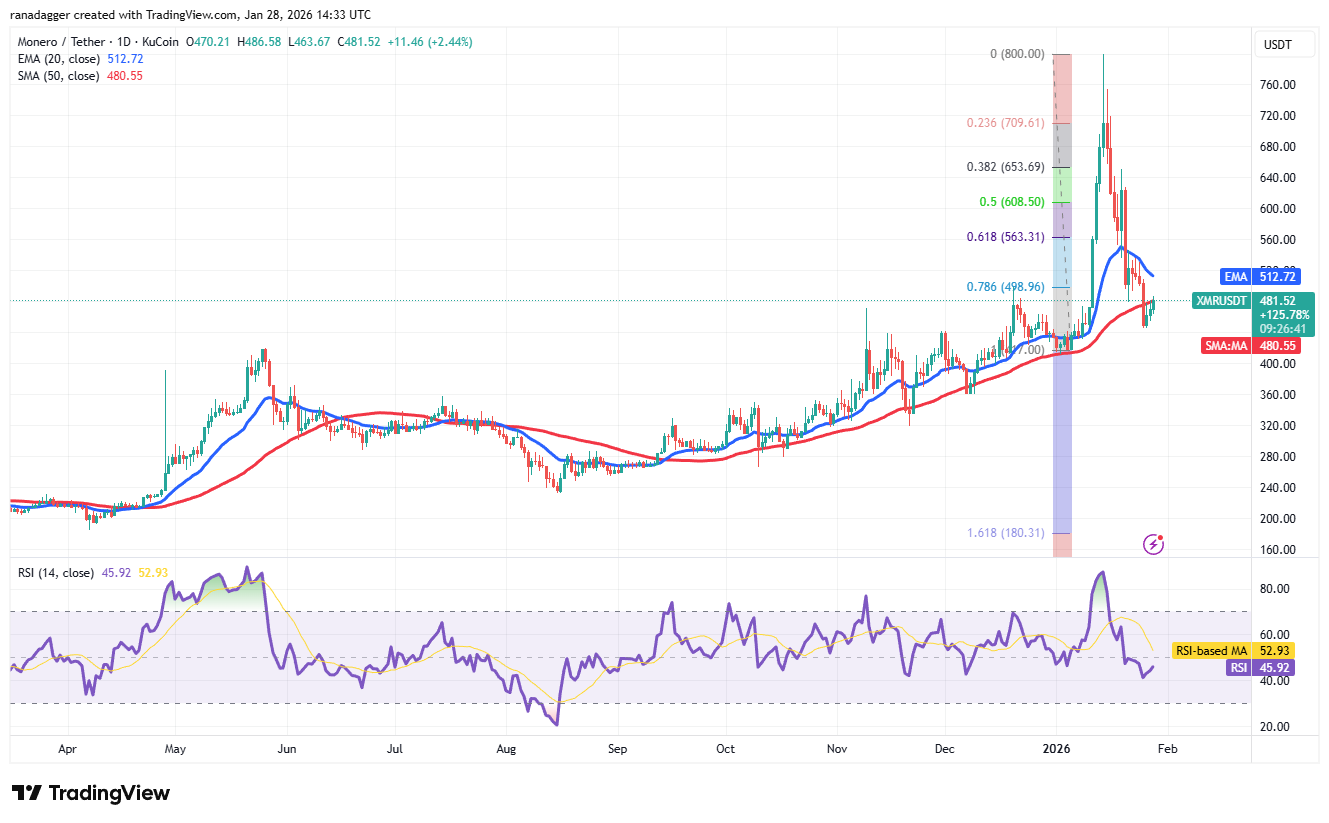
The downsloping 20-day EMA ($512) and the RSI near the 46-level signal that the path of least resistance is to the downside. If the price slips below $445, the XMR/USDT pair may complete a 100% retracement of the latest leg of the rally and plunge to the $417 level.
Buyers will have to drive the Monero price above the 20-day EMA to indicate strength. The pair may then climb to $546. The bullish momentum is expected to pick up on a close above the $546 resistance.
This article does not contain investment advice or recommendations. Every investment and trading move involves risk, and readers should conduct their own research when making a decision. While we strive to provide accurate and timely information, Cointelegraph does not guarantee the accuracy, completeness, or reliability of any information in this article. This article may contain forward-looking statements that are subject to risks and uncertainties. Cointelegraph will not be liable for any loss or damage arising from your reliance on this information.
Read the full article here