Across the U.S., age profiles vary widely by region.
This map, via Visual Capitalist’s Niccolo Conte, highlights those differences using the most recent nationwide estimates.
The data for this visualization comes from the U.S. Census Bureau’s American Community Survey (ACS) 2024 1-Year Estimates.
It reports the median age for each state and the District of Columbia.
The Oldest States Are Concentrated in the Northeast
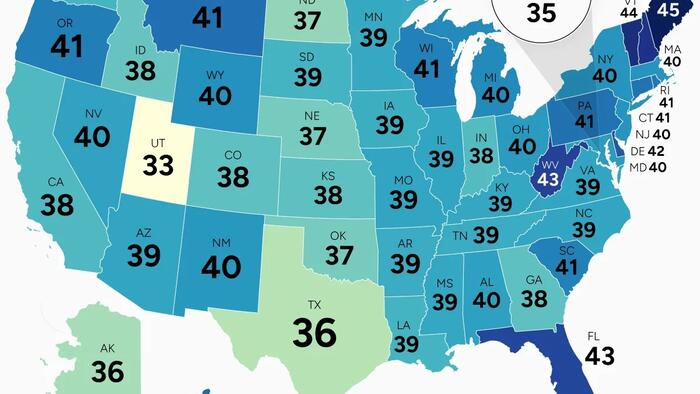
The national median age stands at 39.2 as of 2024.
| Rank | State | Median age overall |
|---|---|---|
| 1 | Maine | 44.9 |
| 2 | Vermont | 43.9 |
| 3 | New Hampshire | 43.6 |
| 4 | West Virginia | 42.9 |
| 5 | Florida | 42.7 |
| 6 | Delaware | 42.1 |
| 7 | Hawaii | 41.5 |
| 8 | Montana | 41.3 |
| 9 | Connecticut | 41.2 |
| 10 | Pennsylvania | 41.2 |
| 11 | Rhode Island | 41.0 |
| 12 | Oregon | 40.8 |
| 13 | South Carolina | 40.7 |
| 14 | Wisconsin | 40.7 |
| 15 | Michigan | 40.4 |
| 16 | Wyoming | 40.2 |
| 17 | Massachusetts | 40.1 |
| 18 | New Jersey | 40.1 |
| 19 | New York | 40.1 |
| 20 | New Mexico | 39.9 |
| 21 | Maryland | 39.8 |
| 22 | Ohio | 39.8 |
| 23 | Alabama | 39.6 |
| 24 | Nevada | 39.5 |
| 25 | Arizona | 39.4 |
| 26 | Illinois | 39.4 |
| 27 | Missouri | 39.4 |
| 28 | North Carolina | 39.4 |
| 29 | Virginia | 39.4 |
| 30 | Kentucky | 39.3 |
| 31 | Mississippi | 39.3 |
| 32 | Minnesota | 39.2 |
| 33 | Arkansas | 39.1 |
| 34 | Tennessee | 39.1 |
| 35 | Iowa | 39.0 |
| 36 | Louisiana | 38.7 |
| 37 | South Dakota | 38.7 |
| 38 | Washington | 38.7 |
| 39 | California | 38.4 |
| 40 | Indiana | 38.3 |
| 41 | Colorado | 38.0 |
| 42 | Georgia | 38.0 |
| 43 | Kansas | 38.0 |
| 44 | Idaho | 37.8 |
| 45 | Nebraska | 37.4 |
| 46 | Oklahoma | 37.4 |
| 47 | North Dakota | 36.7 |
| 48 | Alaska | 36.3 |
| 49 | Texas | 35.9 |
| 50 | District of Columbia | 34.9 |
| 51 | Utah | 32.5 |
| — | U.S. Median Age | 39.2 |
New England and nearby states dominate the top of the ranking. Maine leads the country with a median age of 45, followed by Vermont and New Hampshire at 44. Several other northeastern states—including Pennsylvania, Connecticut, and Rhode Island—also exceed 41.
These older age profiles reflect long-term trends such as slower population growth, lower birth rates, and limited in-migration of younger workers.
The Sun Belt Shows a Mixed Demographic Picture
Many Sun Belt states cluster near the national average, but with some exceptions.
Florida stands out with a median age of 43, driven by its large retiree population. In contrast, Texas has a median age of 36, reflecting faster population growth and a younger workforce.
Meanwhile, states like Arizona, Nevada, and North Carolina sit close to 39.
Younger Populations Dominate the West and Plains
The youngest states are largely found in the West and Great Plains.
Utah is the clear outlier at 33, supported by higher fertility rates and larger households. The District of Columbia also skews young at 35, due in part to a concentration of working-age adults.
If you enjoyed today’s post, check out Ranked: Renters vs Homeowners by State on Voronoi, the new app from Visual Capitalist.
Loading recommendations…
Read the full article here