
Bitcoin’s MVRV Z-score printed record lows on a rolling two-year basis, making BTC price more “undervalued” than at the pit of past bear markets.
Bitcoin (BTC) may be “close to the end” of its correction as a classic BTC price metric beats records.
Key points:
-
Bitcoin’s MVRV Z-score is at record lows on two-year rolling time frames.
-
The “wild” data is leading to predictions of an imminent BTC price recovery.
-
Analysis says that the precious metals rally is “done for now.”
MVRV Z-score says Bitcoin is “undervalued”
In an X post Friday, crypto trader, analyst and entrepreneur Michaël van de Poppe confirmed the lowest-ever readings for Bitcoin’s MVRV Z-score.
“This is a phenomenal chart,” he told followers about the data, sourced from crypto analyst James Easton.
Easton agreed that the chart now looks “wild,” having fallen to the lowest levels ever recorded.
MVRV refers to market value versus realized value, and measures the price at which the BTC supply last moved (realized cap) relative to the value of all BTC in existence (market cap).
The Z-score divides that ratio by the standard deviation of market cap, giving clear “overvalued” and “undervalued” ranges for Bitcoin at a given point in time.
“The current Z-Score of $BTC is lower than during the bear market bottom in 2015, 2018, COVID crash 2020 and 2022,” Van de Poppe noted about rolling two-year time frames.
“That’s how deep we’re in the bear market, and yes, we’re close to the end of it.”
Raw data from onchain analytics platform Glassnode puts the Z-score at its lowest levels since October 2023. At the time, BTC/USD traded at around $30,000.
The last time that the “live” Z-score dipped into its green “undervalued” zone was at the end of the last bear market in 2022.
Precious metals prep key BTC price “trigger”
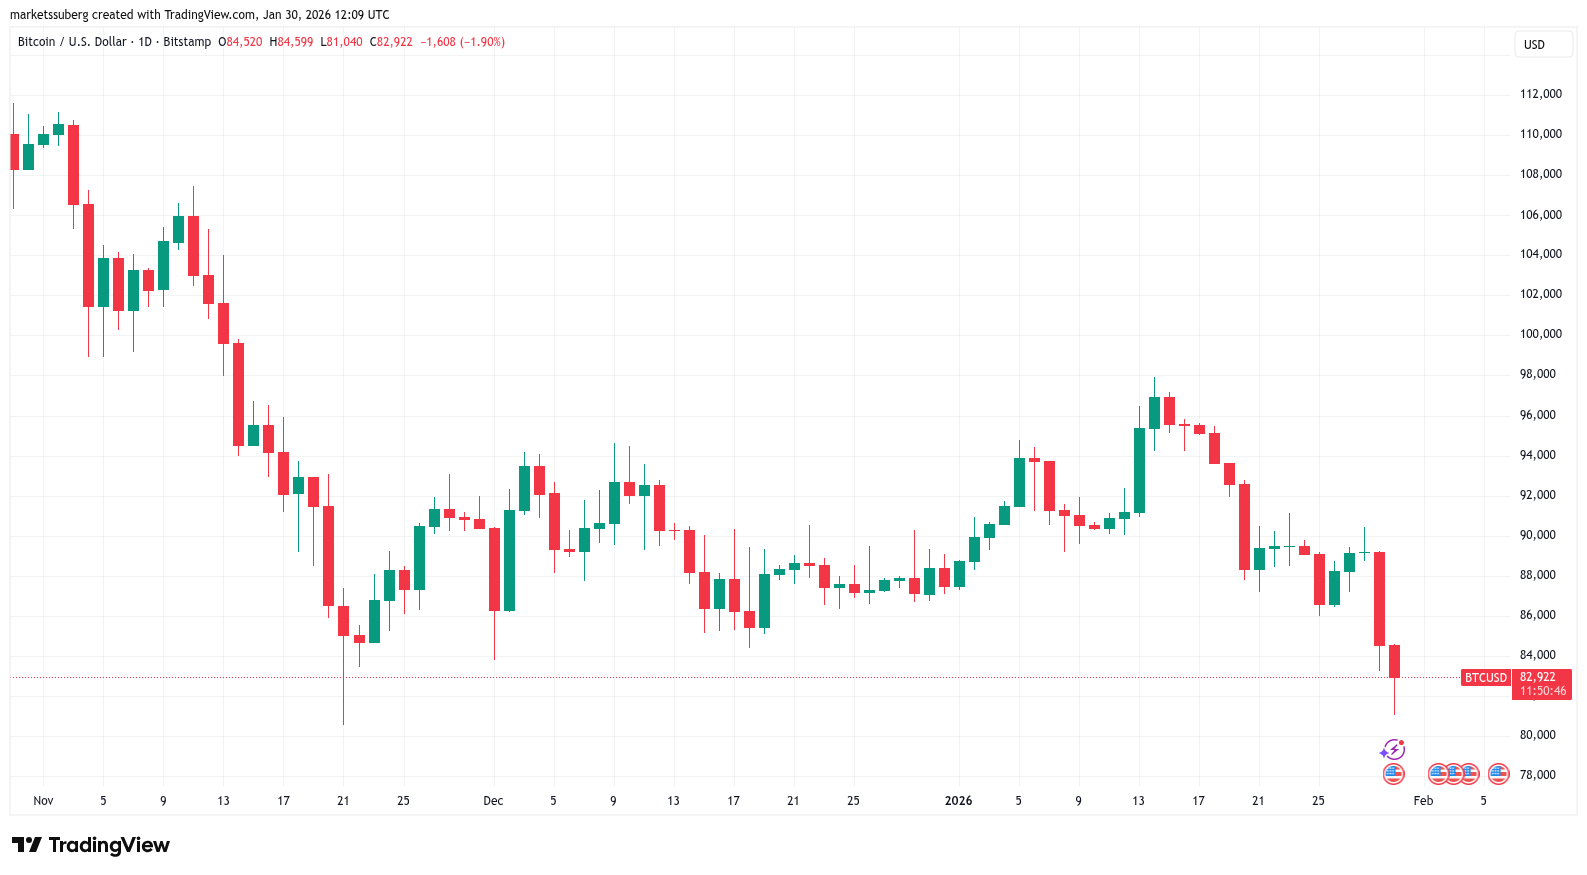
Bitcoin price action fell to new two-month lows this week amid a sudden sell-off across risk assets and precious metals.
Related: Bitcoin trend line cross mimics 2022 amid ‘insane’ BTC vs. silver breakdown
BTC/USD hit $81,040, per data from TradingView, and at the time of writing was still down nearly 2% versus the daily open.
Earlier, Cointelegraph reported on a prediction that the period around the January monthly close would see Bitcoin put in a long-term floor, similar to the end of previous bear markets.
Reacting, Van de Poppe said that both gold and silver were “done for now.”
“The markets are dropping massively, as they are down 10-15% the past 24 hours,” he wrote on X.
“I’m not saying: the bull is over. No, far from it. But it will consolidate, and that’s also the trigger you’d like to see for Bitcoin.”
This article does not contain investment advice or recommendations. Every investment and trading move involves risk, and readers should conduct their own research when making a decision. While we strive to provide accurate and timely information, Cointelegraph does not guarantee the accuracy, completeness, or reliability of any information in this article. This article may contain forward-looking statements that are subject to risks and uncertainties. Cointelegraph will not be liable for any loss or damage arising from your reliance on this information.
Read the full article here