- Canadian Dollar sees little momentum in tight Wednesday trading.
- Markets await the next update on US CPI inflation due Thursday.
- CAD finds little support from struggling Crude Oil bids.
The Canadian Dollar (CAD) is stuck within a tight intraday range on Wednesday as broader markets pivot to focus on Thursday’s upcoming US Consumer Price Index (CPI) inflation print for December. Rate-cut-hungry markets will be looking for continued easing in price growth pressures from the US, but market forecast models are currently expecting a slight uptick in headline inflation figures.
Crude Oil caught a short-lived bounce on Wednesday, fueled by ongoing Middle East tensions and a fresh round of attacks on cargo ships by Houthi rebels. West Texas Intermediate (WTI) US Crude Oil fell back on the day after the Energy Information Administration (EIA) showed another surprise buildup in US Crude Oil stockpiles. The Canadian Dollar is getting less support from rising but choppy Crude Oil prices than usual as currency markets hunker down ahead ofUS CPI inflation.
Daily digest market movers: Canadian Dollar hamstrung in the midrange
- A quiet Wednesday for the Loonie with no further Canadian data releases on the economic calendar docket for the week.
- Canadian Dollar traders will be looking out for Canadian CPI inflation and Retail Sales next week, on Tuesday and Friday, respectively.
- US CPI inflation will dominate headlines and price action this week and is slated for release on Thursday.
- Broader markets are keeping an eye out for any data that will help tilt the Federal Reserve (Fed) into a rate-cutting cycle sooner rather than later.
- Thursday’s MoM US CPI from December is forecast to tick upward slightly from 0.1% to 0.2%.
- Annualized December CPI is also expected to shift from 3.1% to 3.2%.
- December’s MoM Core US CPI is forecast to hold steady at 0.3%, while the annualized Core CPI is seen ticking down from 4.0% to 3.8%.
- An upside beat to inflation data bodes poorly for the market’s rate-cutting hopes, could sever risk appetite if inflation continues to run above expectations.
- US CPI Preview: Forecasts from 10 major banks
- Crude Oil continues to struggle, rising and falling back as supply concerns centered around Middle East tensions play tug-of-war with downside pressure from rising US barrel counts.
- EIA US Crude Stocks climbed by 1.338 million barrels for the week ended January 5 versus the expected drawdown of 675K barrels, taking a chunk out of the previous week’s 5.5 million barrel drawdown.
Canadian Dollar price today
The table below shows the percentage change of Canadian Dollar (CAD) against listed major currencies today. Canadian Dollar was the weakest against the Euro.
| USD | EUR | GBP | CAD | AUD | JPY | NZD | CHF | |
| USD | -0.29% | -0.15% | -0.05% | -0.19% | 0.84% | 0.18% | -0.09% | |
| EUR | 0.28% | 0.13% | 0.24% | 0.10% | 1.13% | 0.46% | 0.23% | |
| GBP | 0.16% | -0.13% | 0.11% | -0.03% | 1.00% | 0.31% | 0.10% | |
| CAD | 0.04% | -0.24% | -0.11% | -0.14% | 0.89% | 0.21% | -0.01% | |
| AUD | 0.18% | -0.11% | 0.03% | 0.14% | 1.01% | 0.34% | 0.11% | |
| JPY | -0.85% | -1.14% | -0.98% | -0.90% | -1.00% | -0.67% | -0.91% | |
| NZD | -0.17% | -0.45% | -0.32% | -0.21% | -0.34% | 0.68% | -0.28% | |
| CHF | 0.07% | -0.22% | -0.06% | 0.03% | -0.09% | 0.92% | 0.26% |
The heat map shows percentage changes of major currencies against each other. The base currency is picked from the left column, while the quote currency is picked from the top row. For example, if you pick the Euro from the left column and move along the horizontal line to the Japanese Yen, the percentage change displayed in the box will represent EUR (base)/JPY (quote).
Technical Analysis: Canadian Dollar skews sideways as markets mix in US CPI run-up
The Canadian Dollar (CAD) is mixed against the major currencies cadre on Wednesday, shedding a little less than a quarter of a percent against the Euro (EUR) but gaining about a fifth of one percent against the New Zealand Dollar (NZD). The CAD has also climbed around nine-tenths of a percent against the battered Japanese Yen (JPY) thanks to a broad-market sell-off in the Yen.
The USD/CAD pair is swamped just below 1.3400, with intraday pressure skewing to the downside as the Loonie-Greenback pairing middles. Near-term price action remains buoyed by the 200-hour Simple Moving Average (SMA) near 1.3325, and bidders will be looking for continued support from a pattern of intraday higher lows driving the pair into the top end in early 2024 trading.
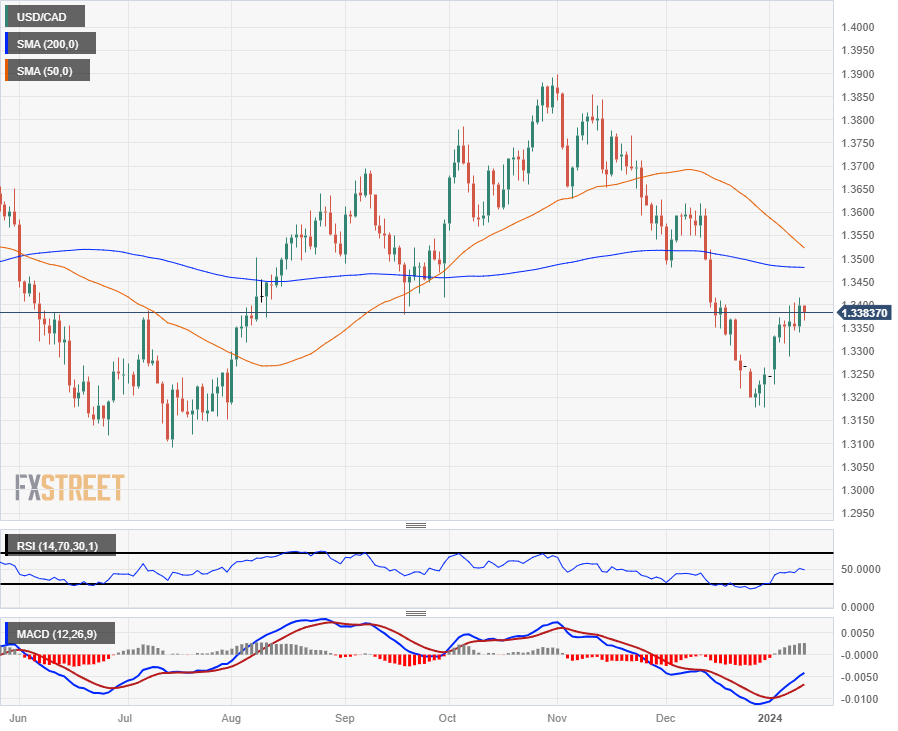
Daily candlesticks have the USD/CAD bid facing a slowdown of bullish momentum from the 1.3400 handle, and a technical ceiling is forming up near 1.3500 as the 50-day SMA heads for a bearish cross of the 200-day SMA. With topside action capped, a pullback could see the pair heading back into December’s lows near the 1.3200 handle.
USD/CAD Hourly Chart
USD/CAD Daily Chart
Interest rates FAQs
Interest rates are charged by financial institutions on loans to borrowers and are paid as interest to savers and depositors. They are influenced by base lending rates, which are set by central banks in response to changes in the economy. Central banks normally have a mandate to ensure price stability, which in most cases means targeting a core inflation rate of around 2%.
If inflation falls below target the central bank may cut base lending rates, with a view to stimulating lending and boosting the economy. If inflation rises substantially above 2% it normally results in the central bank raising base lending rates in an attempt to lower inflation.
Higher interest rates generally help strengthen a country’s currency as they make it a more attractive place for global investors to park their money.
Higher interest rates overall weigh on the price of Gold because they increase the opportunity cost of holding Gold instead of investing in an interest-bearing asset or placing cash in the bank.
If interest rates are high that usually pushes up the price of the US Dollar (USD), and since Gold is priced in Dollars, this has the effect of lowering the price of Gold.
The Fed funds rate is the overnight rate at which US banks lend to each other. It is the oft-quoted headline rate set by the Federal Reserve at its FOMC meetings. It is set as a range, for example 4.75%-5.00%, though the upper limit (in that case 5.00%) is the quoted figure.
Market expectations for future Fed funds rate are tracked by the CME FedWatch tool, which shapes how many financial markets behave in anticipation of future Federal Reserve monetary policy decisions.
Read the full article here