
- The Dow Jones pushed back up into the 43,000 region after upbeat PPI inflation print.
- Market expectations of Fed rate cuts later this year have roared back to life.
- Despite low inflation data this week, potential price impacts from tariffs still loom ahead.
The Dow Jones Industrial Average (DJIA) caught a bullish bid on Thursday, bolstered by better-than-expected Producer Price Index (PPI) inflation data for May. Pricing pressures remain tepid despite the Trump administration’s best efforts to make the US economy pay excess international trade taxes, and the lack of immediate price volatility impacts are re-igniting market expectations of a Federal Reserve (Fed) rate cut in September.
PPI inflation rebounded in May, and previous data saw a slight upward revision, but the overall figures still came in below median market forecasts. Annualized core PPI inflation eased to 3.0% YoY, while headline PPI inflation rose to 2.6% YoY.
This week’s overall tepid inflation data for both consumers and producers has galvanized market bets for the start of the Fed’s next rate-cutting cycle. According to the CME’s FedWatch Tool, rate traders are pricing in nearly 80% odds of at least a 25 basis point rate trim when the Fed gathers for its September rate call. In the meantime, the Fed is expected to continue holding rates flat for the next two rate meetings.
The University of Michigan’s (UoM) Consumer Sentiment Index for June will land on markets on Friday to wrap up the trading week, and median market forecasts expect an overall rebound in aggregated consumer sentiment survey results. Investors will also keep a close eye on the UoM’s 1-year and 5-year Consumer Inflation Expectations, which are holding uncomfortably high at 6.6% and 4.2%, respectively.
Dow Jones price forecast
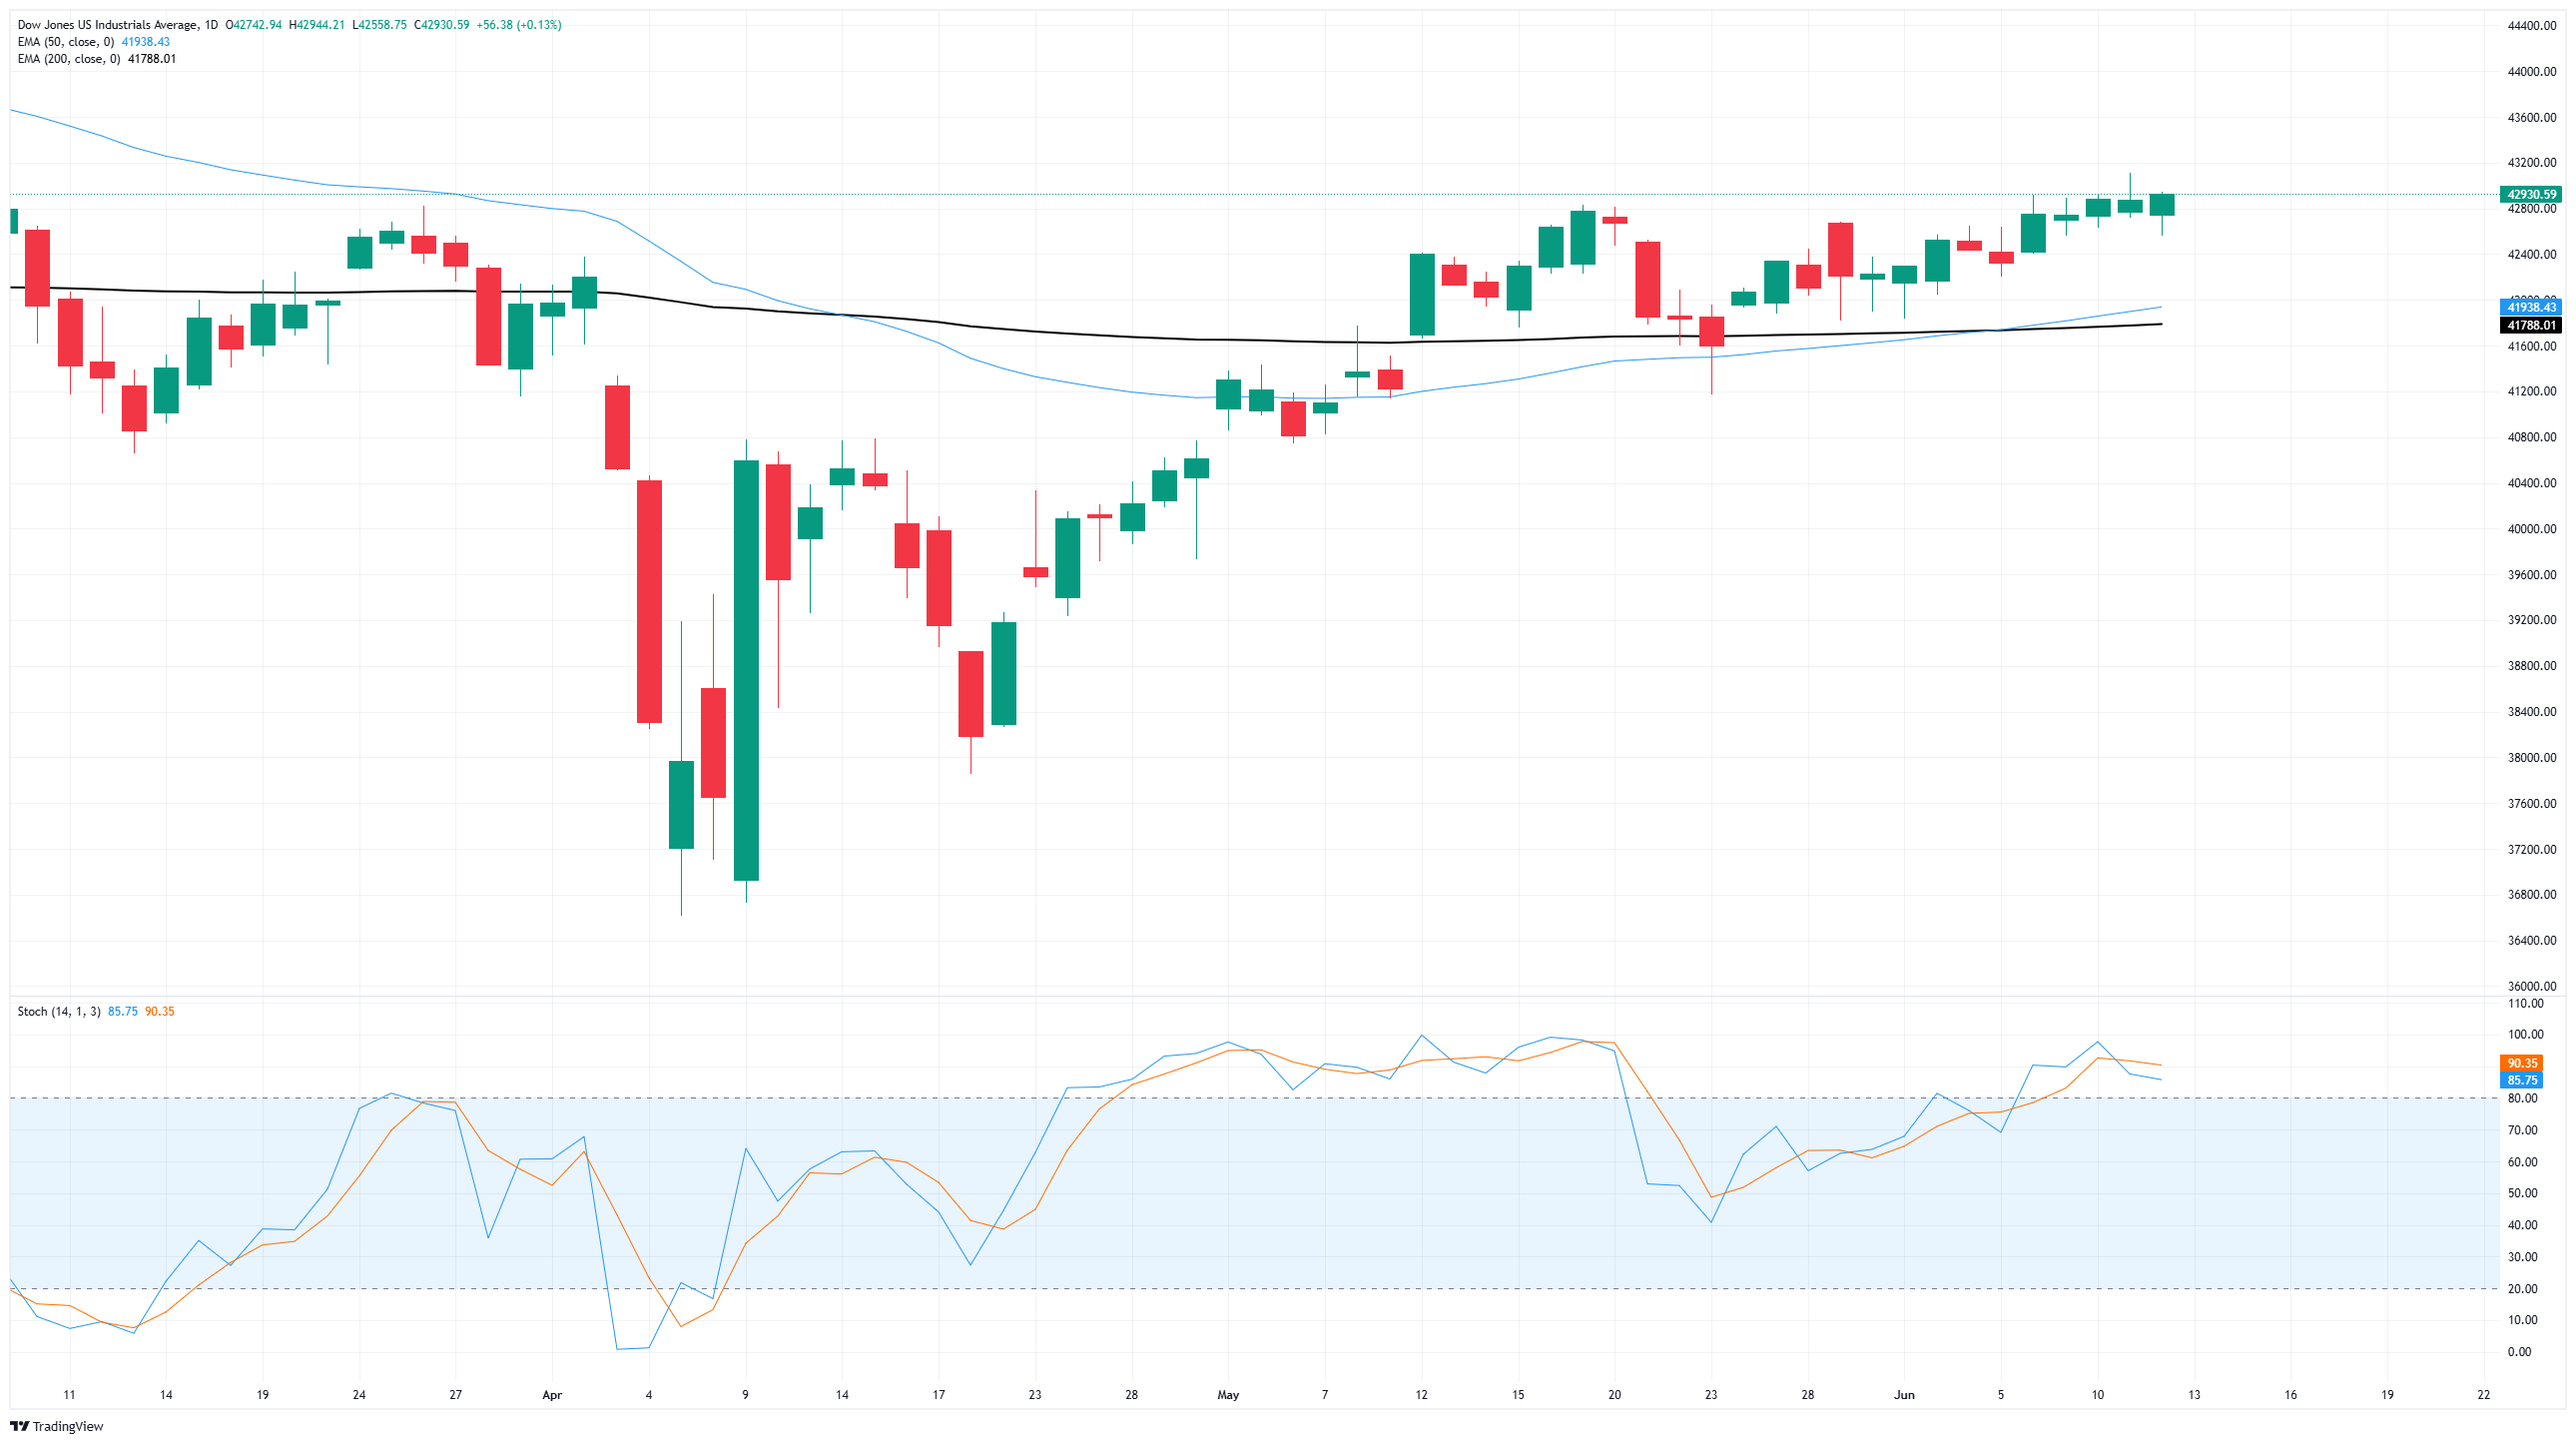
Thursday’s bullish push is keeping the Dow Jones Industrial Average within touch range of the 43,000 major price handle, but meaningful momentum remains limited. Price action continues to get mired in a recent congestion zone, and the major equity index is struggling to put distance between bids and the 200-day Exponential Moving Average (EMA) near 41,780.
Dow Jones daily chart
Economic Indicator
Producer Price Index (YoY)
The Producer Price Index released by the Bureau of Labor statistics, Department of Labor measures the average changes in prices in primary markets of the US by producers of commodities in all states of processing. Changes in the PPI are widely followed as an indicator of commodity inflation. Generally speaking, a high reading is seen as positive (or bullish) for the USD, whereas a low reading is seen as negative (or bearish).
Read more.
Read the full article here