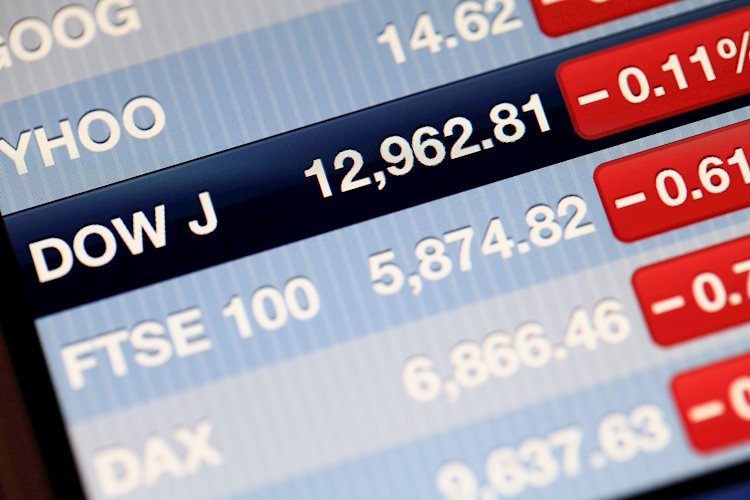
- Dow Jones index is practically flat on afternun trading after having given away early gains.
- High yields and concerns about an escalation of the Middle East conflict have offset the upbeat quarterly results by Goldman Sachs.
- The technical picture remains bearish with DJIA drifting away from March high.
The Dow Jones Industrial Average (DJIA) is trading with marginal gains in the early afternoon after opening the week in green. Better than expected quarterly results by Goldman Sachs boosted risk appetite at the session opening although market sentiment soured as US Treasury yields rallied, following US Retail Sales data. Beyond that, investors remain wary as Israel debates its options to retaliate against Iran, which is weighing on risk appetite further and, crushing demand for equities.
Retail Sales data from the US has beaten expectations, confirming the strong momentum of the US economy. This is positive for market sentiment, although its consequences for monetary policy push back on hopes of interest rate cuts by the Federal Reserve (Fed), creating negative pressure on stocks.
Against this backdrop, most, Wall Street indexes have swung into negative territory. The NASDAQ is leading losses with a 0.65% decline to 16,0698, followed by the S&P 500 which is 0.42% down at 5,102 and the Dow Jones, with a 0.2% decline to 37,910.
Dow Jones news
Most of the Wall Street sectors are in red on Monday afternoon trading, Real Estate leading losses with a 1.73% decline, followed by Technology, which is losing 1.43% and Communication Services, 1.38% down. Only the Health sector escapes from a broad-based decline, trading practically at opening levels.
Goldman Sachs (GS) is leading gains on Monday with a 2.65% rally to $399.85, followed by United Health Group (UNH), which rises 1.72% to $446.75. On the losing end, Salesforce (CRM) drops 5.83% to $277.46 as news reports suggest that the software firm is in talks to acquire Informatica. next is Visa (V), 1.5% down to $271.81.
Dow Jones technical outlook
The technical picture shows bears in control as the Dow Jones index drifts away from the historic highs reached in March. The move below 38,560 has activated a bearish Head & Shoulders pattern that might hint toward a sharper decline.
The next bearish target is 37,825. Below here the measured target of the H&S pattern, which meets the mid-January low and 38.6% Fibonacci retracement, comes at 37,087. A bullish reaction should overcome the 38,540 to open the path toward 39,000 (order block).
Dow Jones Index 4 -Hour Chart
Nasdaq FAQs
The Nasdaq is a stock exchange based in the US that started out life as an electronic stock quotation machine. At first, the Nasdaq only provided quotations for over-the-counter (OTC) stocks but later it became an exchange too. By 1991, the Nasdaq had grown to account for 46% of the entire US securities’ market. In 1998, it became the first stock exchange in the US to provide online trading. The Nasdaq also produces several indices, the most comprehensive of which is the Nasdaq Composite representing all 2,500-plus stocks on the Nasdaq, and the Nasdaq 100.
The Nasdaq 100 is a large-cap index made up of 100 non-financial companies from the Nasdaq stock exchange. Although it only includes a fraction of the thousands of stocks in the Nasdaq, it accounts for over 90% of the movement. The influence of each company on the index is market-cap weighted. The Nasdaq 100 includes companies with a significant focus on technology although it also encompasses companies from other industries and from outside the US. The average annual return of the Nasdaq 100 has been 17.23% since 1986.
There are a number of ways to trade the Nasdaq 100. Most retail brokers and spread betting platforms offer bets using Contracts for Difference (CFD). For longer-term investors, Exchange-Traded Funds (ETFs) trade like shares that mimic the movement of the index without the investor needing to buy all 100 constituent companies. An example ETF is the Invesco QQQ Trust (QQQ). Nasdaq 100 futures contracts allow traders to speculate on the future direction of the index. Options provide the right, but not the obligation, to buy or sell the Nasdaq 100 at a specific price (strike price) in the future.
Many different factors drive the Nasdaq 100 but mainly it is the aggregate performance of the component companies revealed in their quarterly and annual company earnings reports. US and global macroeconomic data also contributes as it impacts on investor sentiment, which if positive drives gains. The level of interest rates, set by the Federal Reserve (Fed), also influences the Nasdaq 100 as it affects the cost of credit, on which many corporations are heavily reliant. As such the level of inflation can be a major driver too as well as other metrics which impact on the decisions of the Fed.
Read the full article here