
- EUR/USD continues to grapple with 1.0800.
- Euro area GDP figures due in the midweek, after Tuesday’s US CPI inflation.
- An appearance from ECB President Lagarde due later in the week.
EUR/USD tested 1.0800 on Monday, but broad-market flows remain tepid in thin action to kick off the new trading week. A light data calendar on Monday will give way to a fresh print of US Consumer Price Index (CPI) inflation figures on Tuesday, and investors will be keeping a close eye on price growth figures from the US.
The euro area sees Gross Domestic Product (GDP) figures on Wednesday, to be followed by an appearance from European Central Bank (ECB) President Christine Lagarde on Thursday. The US’ Tuesday CPI inflation gives way to US Retail Sales on Thursday.
Daily digest market movers: EUR/USD capped by descending 200-day SMA as markets await data
- Quiet Monday leaves EUR/USD constrained in a familiar midrange.
- Bullish momentum remains capped by median technical barriers.
- Higher lows continue to push higher despite constrained momentum.
- Tuesday’s US YoY Core CPI inflation is expected to tick down to 3.7% from 3.9%.
- January’s MoM CPI headline inflation forecast to hold steady at 0.2% after the Bureau of Labor Statistics introduced changed seasonal adjustment methods, December’s figure gets revised down from 0.3%.
- Euro area GDP growth is broadly forecast to hold steady at 0.11% for the year ended in the fourth quarter.
- US Retail Sales expected to ease -0.1% in January compared to December’s 0.6% gain.
Euro price today
The table below shows the percentage change of Euro (EUR) against listed major currencies today. Euro was the strongest against the New Zealand Dollar.
| USD | EUR | GBP | CAD | AUD | JPY | NZD | CHF | |
| USD | 0.22% | 0.06% | -0.05% | -0.09% | 0.12% | 0.26% | 0.17% | |
| EUR | -0.22% | -0.16% | -0.27% | -0.29% | -0.10% | 0.04% | -0.05% | |
| GBP | -0.06% | 0.16% | -0.10% | -0.14% | 0.06% | 0.20% | 0.11% | |
| CAD | 0.05% | 0.27% | 0.10% | -0.04% | 0.16% | 0.31% | 0.22% | |
| AUD | 0.08% | 0.30% | 0.14% | 0.04% | 0.20% | 0.35% | 0.25% | |
| JPY | -0.12% | 0.08% | -0.04% | -0.15% | -0.20% | 0.13% | 0.05% | |
| NZD | -0.27% | -0.04% | -0.20% | -0.31% | -0.35% | -0.14% | -0.09% | |
| CHF | -0.17% | 0.05% | -0.11% | -0.22% | -0.25% | -0.05% | 0.09% |
The heat map shows percentage changes of major currencies against each other. The base currency is picked from the left column, while the quote currency is picked from the top row. For example, if you pick the Euro from the left column and move along the horizontal line to the Japanese Yen, the percentage change displayed in the box will represent EUR (base)/JPY (quote).
Technical analysis: EUR/USD drives in circles on Monday as 1.0800 proves too slippery
EUR/USD climbed into 1.0800 for the first time since falling back below the key handle in early February. The pair has been steadily grinding higher from February’s early lows near 1.0720, buit steady momentum into the upside sees plenty of technical resistance.
The pair remains capped by the 200-hour Simple Moving Average (SMA), and Monday’s test above 1.0800 saw the EUR/USD quickly rejected back into the 1.0770 region.
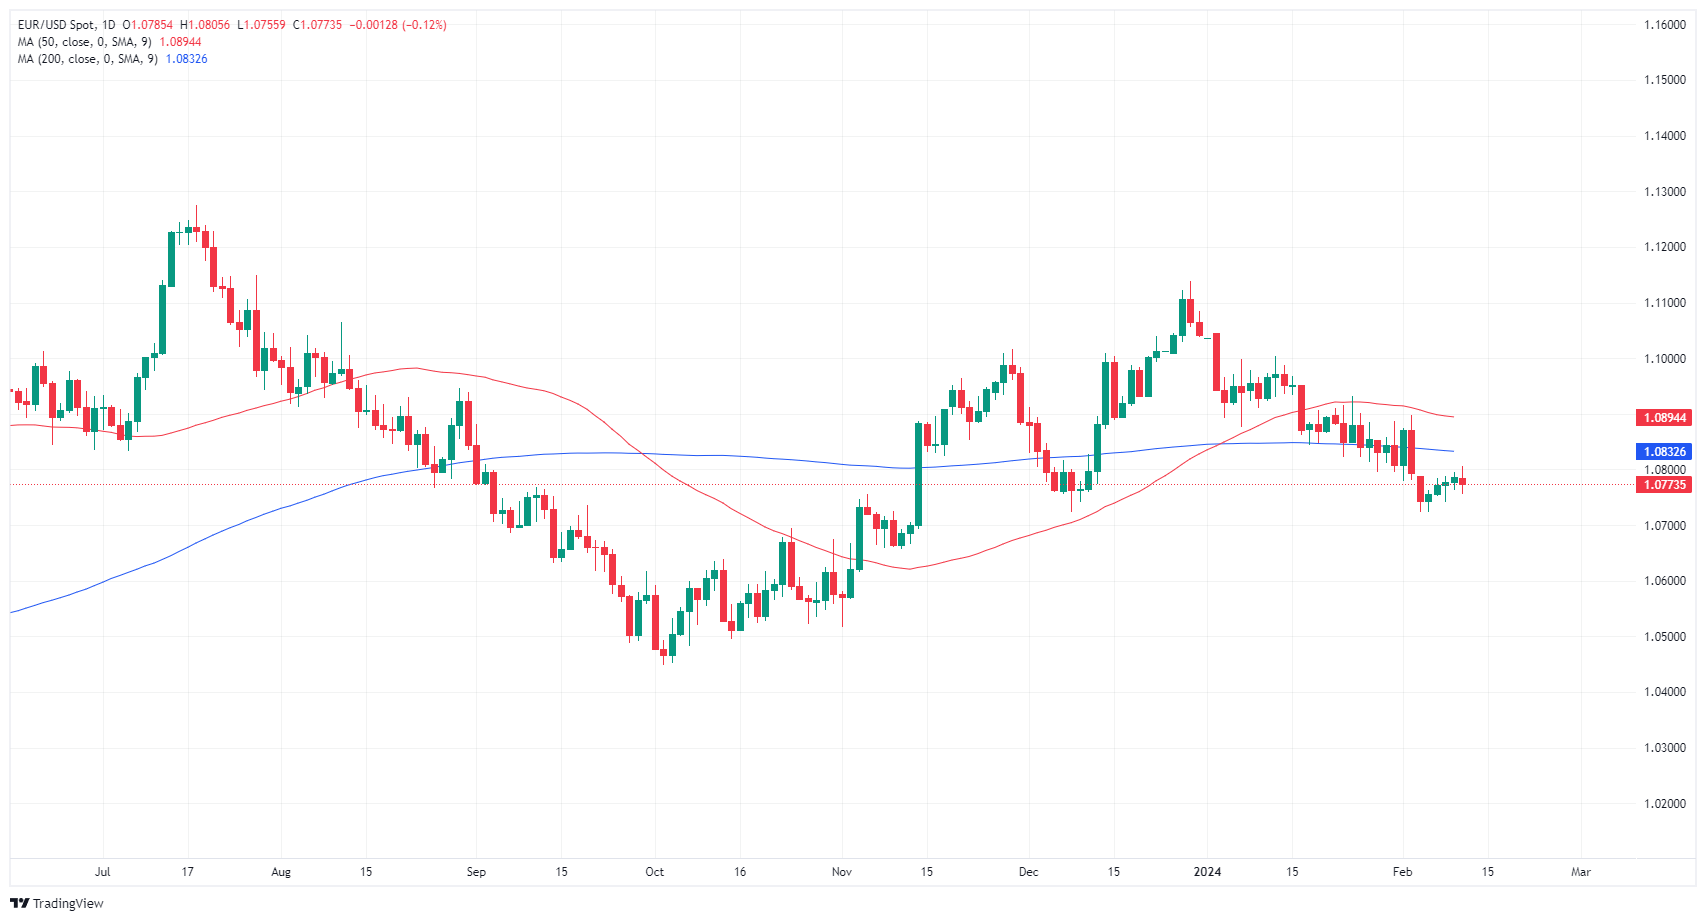
Despite four straight days of gains for the EUR/USD, the pair remains on the bearish side of the 200-day SMA near 1.0830. The EUR/USD remains down over 3% from December’s peak bids near 1.1150, and a bearish trend sees little topside potential for the pair as the 50-day SMA turns bearish and is set for a downside crossover of the 200-day SMA.
EUR/USD hourly chart
EUR/USD daily chart![]()
Inflation FAQs
Inflation measures the rise in the price of a representative basket of goods and services. Headline inflation is usually expressed as a percentage change on a month-on-month (MoM) and year-on-year (YoY) basis. Core inflation excludes more volatile elements such as food and fuel which can fluctuate because of geopolitical and seasonal factors. Core inflation is the figure economists focus on and is the level targeted by central banks, which are mandated to keep inflation at a manageable level, usually around 2%.
The Consumer Price Index (CPI) measures the change in prices of a basket of goods and services over a period of time. It is usually expressed as a percentage change on a month-on-month (MoM) and year-on-year (YoY) basis. Core CPI is the figure targeted by central banks as it excludes volatile food and fuel inputs. When Core CPI rises above 2% it usually results in higher interest rates and vice versa when it falls below 2%. Since higher interest rates are positive for a currency, higher inflation usually results in a stronger currency. The opposite is true when inflation falls.
Although it may seem counter-intuitive, high inflation in a country pushes up the value of its currency and vice versa for lower inflation. This is because the central bank will normally raise interest rates to combat the higher inflation, which attract more global capital inflows from investors looking for a lucrative place to park their money.
Formerly, Gold was the asset investors turned to in times of high inflation because it preserved its value, and whilst investors will often still buy Gold for its safe-haven properties in times of extreme market turmoil, this is not the case most of the time. This is because when inflation is high, central banks will put up interest rates to combat it.
Higher interest rates are negative for Gold because they increase the opportunity-cost of holding Gold vis-a-vis an interest-bearing asset or placing the money in a cash deposit account. On the flipside, lower inflation tends to be positive for Gold as it brings interest rates down, making the bright metal a more viable investment alternative.
Read the full article here