- USD/CAD continues Friday’s thin drift near the 1.3500 handle.
- Canada wholesale trade likely fell 0.6% in January.
- US New Home Sales rose 1.5% vs 7.2% previous, Durable Goods due tomorrow.
USD/CAD is stuck in a slow drift near 1.3500 as markets gear up for the week. Economic data remains thin on Monday, and traders will be looking ahead to Tuesday’s US Durable Goods Orders for January, as well as Wednesday’s US Gross Domestic Product (GDP) growth for the fourth quarter.
Canada is predominantly underrepresented on the economic calendar until Thursday’s Canadian GDP Q4 performance. StatCan noted on Monday that Canadian wholesale trade likely fell in January with January’s Canadian manufacturing sales seeing a slight bump.
Daily digest market movers: USD/CAD gears up for a key data week with easy Monday
- According to StatCan Flash Estimate, Canada’s January wholesale trade likely fell by 0.6% MoM, while January manufacturing sales likely rose 0.4% MoM.
- US New Home Sales Change rose 1.5% MoM in January compared to the previous month’s 7.2% (revised from 8.0%).
- US New Home Sales in January 661K versus 680K, previous 651K (revised from 664K).
- Tuesday’s US Durable Goods Orders for January is forecast to decline 4.8% MoM, previous print 0.0%.
- Canada’s Current Account is expected to record -1.25 billion on Wednesday, -3.22 billion previous.
- US fourth-quarter GDP growth forecast to hold steady at 3.3% for the year ended 4Q.
- Canada’s Q4 GDP slated for Thursday, forecast to rebound to 0.8% QoQ versus the previous -1.1%.
Canadian Dollar price today
The table below shows the percentage change of Canadian Dollar (CAD) against listed major currencies today. Canadian Dollar was the strongest against the Australian Dollar.
| USD | EUR | GBP | CAD | AUD | JPY | NZD | CHF | |
| USD | -0.27% | -0.08% | 0.08% | 0.38% | 0.14% | 0.25% | -0.06% | |
| EUR | 0.27% | 0.19% | 0.34% | 0.65% | 0.39% | 0.51% | 0.21% | |
| GBP | 0.08% | -0.19% | 0.15% | 0.46% | 0.22% | 0.33% | 0.02% | |
| CAD | -0.07% | -0.35% | -0.15% | 0.34% | 0.03% | 0.17% | -0.15% | |
| AUD | -0.42% | -0.65% | -0.46% | -0.32% | -0.24% | -0.15% | -0.45% | |
| JPY | -0.15% | -0.41% | -0.15% | -0.08% | 0.25% | 0.10% | -0.20% | |
| NZD | -0.24% | -0.50% | -0.30% | -0.15% | 0.15% | -0.08% | -0.29% | |
| CHF | 0.06% | -0.19% | 0.01% | 0.15% | 0.48% | 0.20% | 0.32% |
The heat map shows percentage changes of major currencies against each other. The base currency is picked from the left column, while the quote currency is picked from the top row. For example, if you pick the Euro from the left column and move along the horizontal line to the Japanese Yen, the percentage change displayed in the box will represent EUR (base)/JPY (quote).
Technical analysis: USD/CAD sees technical floor near 1.3500 as pair churns
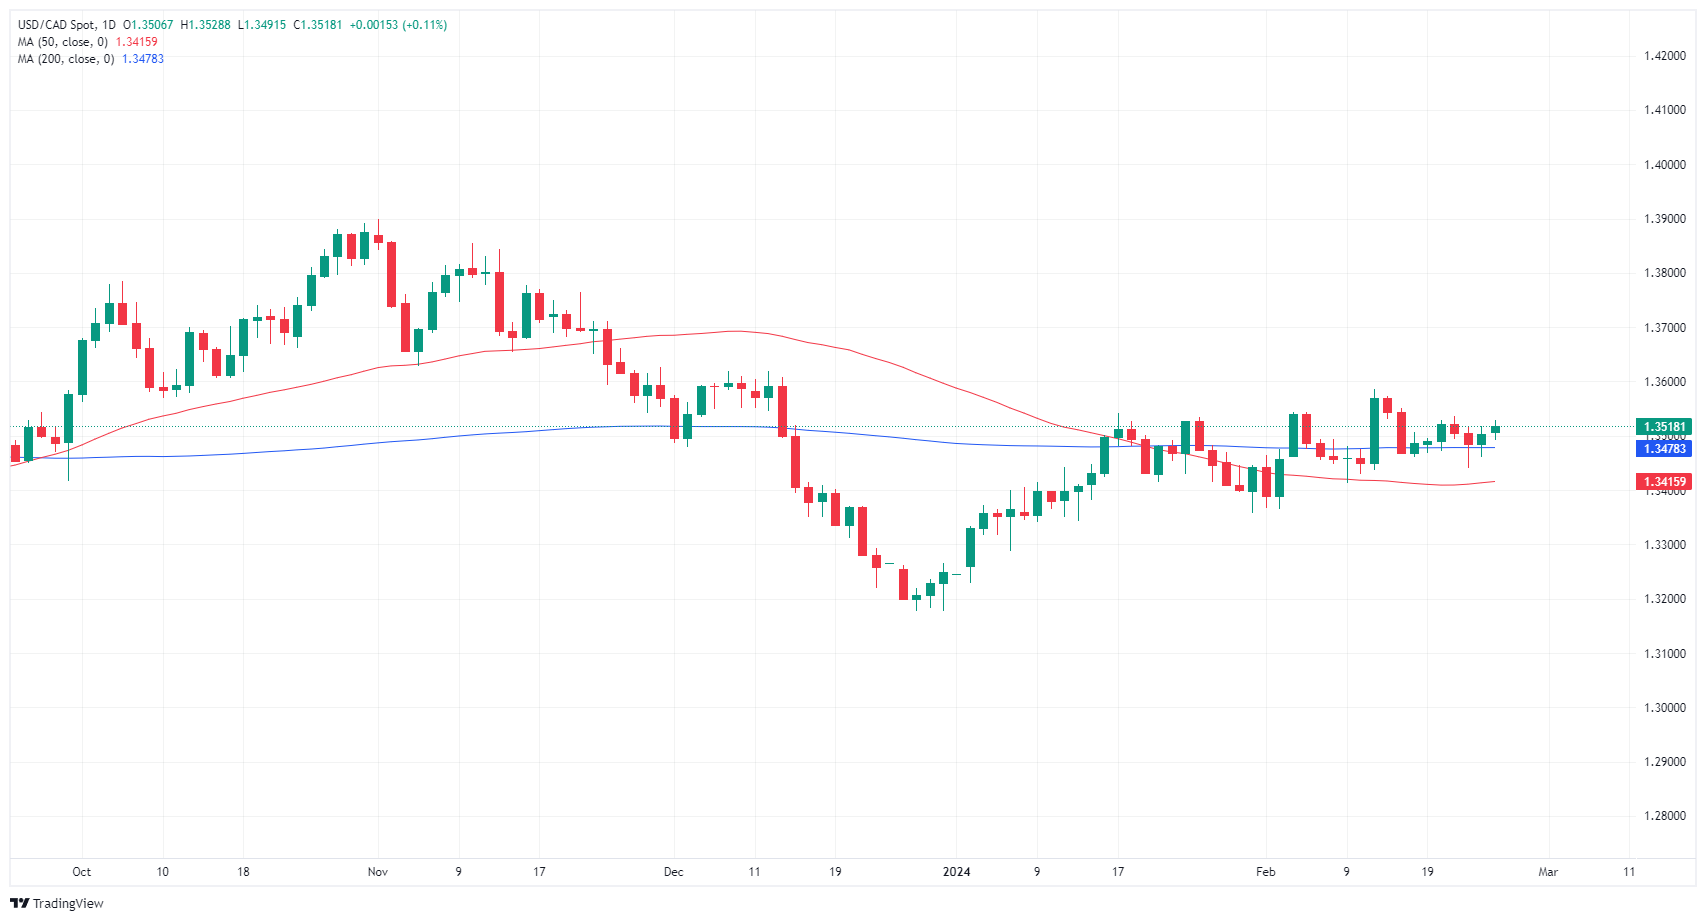
USD/CAD near-term technical action continues to see a sideways grind as investors grapple with picking a meaningful direction. 1.3500 remains a key technical level, keeping intraday bids magnetized to the major price handle. USD/CAD has cycled 1.3500 in a rough sideways channel since February 5.
Daily candlesticks remain stuck to the 200-day Simple Moving Average (SMA) at 1.3478 just beneath 1.3500. USD/CAD remains stuck in the middle ground between December’s lows near 1.3177 and last November’s early peak near 1.3900.
USD/CAD hourly chart
USD/CAD daily chart![]()
GDP FAQs
A country’s Gross Domestic Product (GDP) measures the rate of growth of its economy over a given period of time, usually a quarter. The most reliable figures are those that compare GDP to the previous quarter e.g Q2 of 2023 vs Q1 of 2023, or to the same period in the previous year, e.g Q2 of 2023 vs Q2 of 2022.
Annualized quarterly GDP figures extrapolate the growth rate of the quarter as if it were constant for the rest of the year. These can be misleading, however, if temporary shocks impact growth in one quarter but are unlikely to last all year – such as happened in the first quarter of 2020 at the outbreak of the covid pandemic, when growth plummeted.
A higher GDP result is generally positive for a nation’s currency as it reflects a growing economy, which is more likely to produce goods and services that can be exported, as well as attracting higher foreign investment. By the same token, when GDP falls it is usually negative for the currency.
When an economy grows people tend to spend more, which leads to inflation. The country’s central bank then has to put up interest rates to combat the inflation with the side effect of attracting more capital inflows from global investors, thus helping the local currency appreciate.
When an economy grows and GDP is rising, people tend to spend more which leads to inflation. The country’s central bank then has to put up interest rates to combat the inflation. Higher interest rates are negative for Gold because they increase the opportunity-cost of holding Gold versus placing the money in a cash deposit account. Therefore, a higher GDP growth rate is usually a bearish factor for Gold price.
Read the full article here