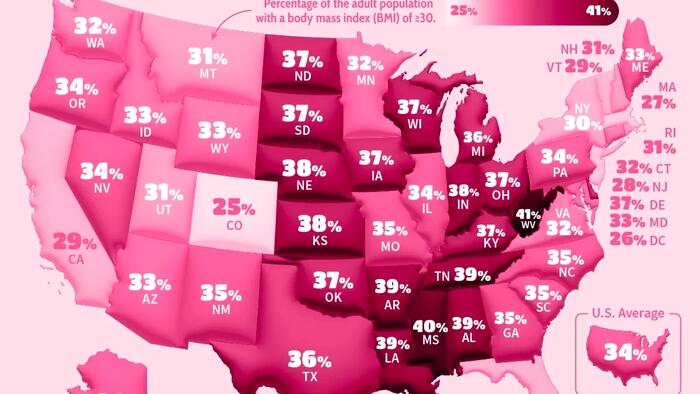
More than one in three adults is obese in most U.S. states, according to the latest CDC data. In several Southern states, the rate now exceeds 40%.
This map, via Visual Capitalist’s Bruno Venditti, shows the percentage of adults with a body mass index (BMI) of 30 or higher across all 50 states and U.S. territories.
The Highest Obesity Rates Are Concentrated in the South
West Virginia tops the list, with 41.4% of adults classified as obese. Mississippi follow at 40.4%, while Alabama, Arkansas, Louisiana, and Tennessee each report rates of roughly 39%.
| Rank | State or Territory | Adult Obesity Rate (2024) |
|---|---|---|
| 1 | West Virginia | 41.4% |
| 2 | Mississippi | 40.4% |
| 3 | Guam | 40.2% |
| 4 | Louisiana | 39.2% |
| 5 | Tennessee* | 38.9% |
| 6 | Alabama | 38.9% |
| 7 | Arkansas | 38.9% |
| 8 | Indiana | 38.4% |
| 9 | Virgin Islands | 37.7% |
| 10 | Kansas | 37.6% |
| 11 | Nebraska | 37.6% |
| 12 | Wisconsin | 37.4% |
| 13 | Kentucky | 37.2% |
| 14 | South Dakota | 37.0% |
| 15 | Ohio | 36.9% |
| 16 | North Dakota | 36.8% |
| 17 | Oklahoma | 36.8% |
| 18 | Delaware | 36.6% |
| 19 | Iowa | 36.6% |
| 20 | Puerto Rico | 36.2% |
| 21 | Michigan | 36.1% |
| 22 | Texas | 35.6% |
| 23 | Georgia | 35.4% |
| 24 | Missouri | 34.6% |
| 25 | South Carolina | 34.6% |
| 26 | New Mexico | 34.5% |
| 27 | North Carolina | 34.5% |
| 28 | Illinois | 34.2% |
| 29 | Nevada | 34.2% |
| 30 | Pennsylvania | 34.2% |
| 31 | Alaska | 34.0% |
| 32 | Oregon | 33.5% |
| 33 | Arizona | 33.3% |
| 34 | Maine | 33.2% |
| 35 | Idaho | 32.7% |
| 36 | Maryland | 32.7% |
| 37 | Wyoming | 32.5% |
| 38 | Minnesota | 32.3% |
| 39 | Virginia | 32.3% |
| 40 | Connecticut | 32.0% |
| 41 | Washington | 31.5% |
| 42 | New Hampshire | 31.1% |
| 43 | Rhode Island | 31.1% |
| 44 | Montana | 31.0% |
| 45 | Utah | 31.0% |
| 46 | Florida | 29.6% |
| 47 | New York | 29.5% |
| 48 | California | 29.1% |
| 49 | Vermont | 29.0% |
| 50 | New Jersey | 27.7% |
| 51 | Hawaii | 27.0% |
| 52 | Massachusetts | 27.0% |
| 53 | District of Columbia | 25.5% |
| 54 | Colorado | 25.0% |
| — | 🇺🇸 U.S. State and Territory Average | 34.1% |
*Note: Data for Tennessee is from 2022.
Much of the Southeast and parts of Appalachia cluster near the top of the rankings. These regions have historically faced higher poverty rates, limited healthcare access, and lower levels of physical activity. Diet patterns and food accessibility also play a role, particularly in rural communities.
The West and Northeast Report Lower Rates
Colorado stands out with the lowest adult obesity rate at 25%, followed by the District of Columbia at 25.5%. Hawaii and Massachusetts both come in at 27%, while New Jersey posts 27.7%.
Western states tend to report lower rates overall, with many in the low 30% range. Higher levels of outdoor recreation, urban density, and public health initiatives may contribute to these comparatively lower figures.
Nearly Every State Is Above 30%
A striking pattern emerges from the data: obesity is widespread across the country. Aside from a handful of states and jurisdictions, most report rates of 30% or higher.
Midwestern states such as Ohio (36.9%), Wisconsin (37.4%), and Indiana (38.4%) also report elevated rates.
Rising obesity rates are closely tied to increased healthcare costs and higher risks of conditions like diabetes, heart disease, and certain cancers.
To learn more about healthcare, check out this graphic on America’s most common drugs.
Read the full article here